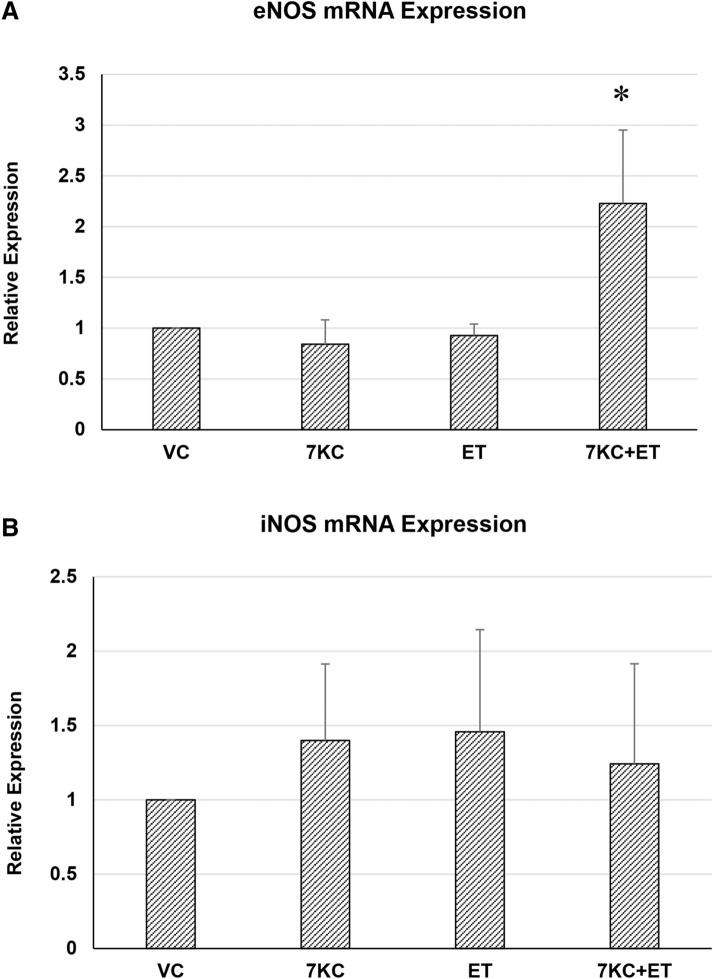
Fig. 6.
Quantitative RT-PCR of eNOS a or iNOS b mRNA expression after 7KC and /or ET treatment. hCMEC/D3 cells were pre-treated with 1 mM ET for 1 h, followed by co-treatment with 30 μM 7KC for 24 h. No significant changes in mRNA expression of these two NOS isoforms were detected. Data are represented as mean ± S.E.M (n = 4). * Significant difference compared to 7KC (p < 0.01)

