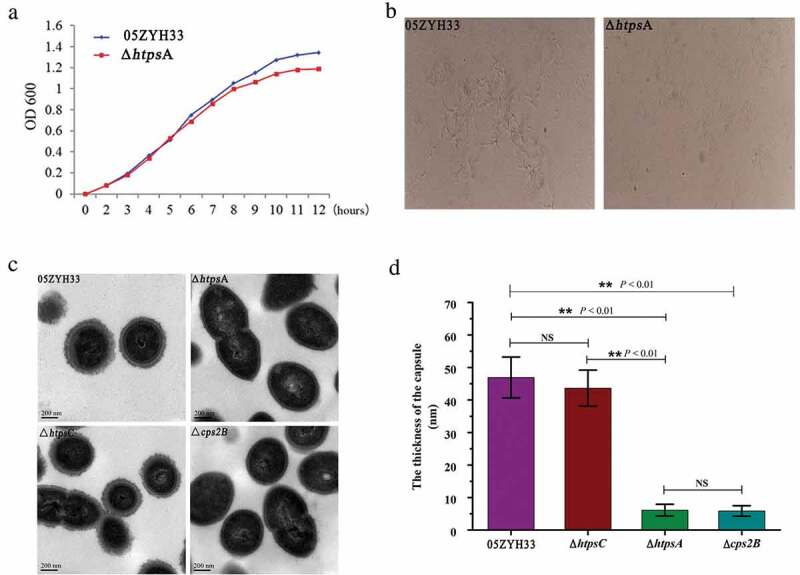
Figure 2.

Phenotypic analysis of the 05ZYH33 and ΔhtpsA mutant strains. (a) Cell density was measured spectrophotometrically at a wavelength of 600 nm. (b) Antiserum aggregation reaction of the ΔhtpsA and 05ZYH33. (c) Observation of capsular morphology of the ΔhtpsA, ΔhtpsC, Δcps2B and the wild-type strains by transmission electron microscopy. (d) Determination and analysis of capsule thickness of the ΔhtpsA, ΔhtpsC, Δcps2B and wild-type strains. ** represents significant differences (P < 0.01), NS represents no significant differences.
