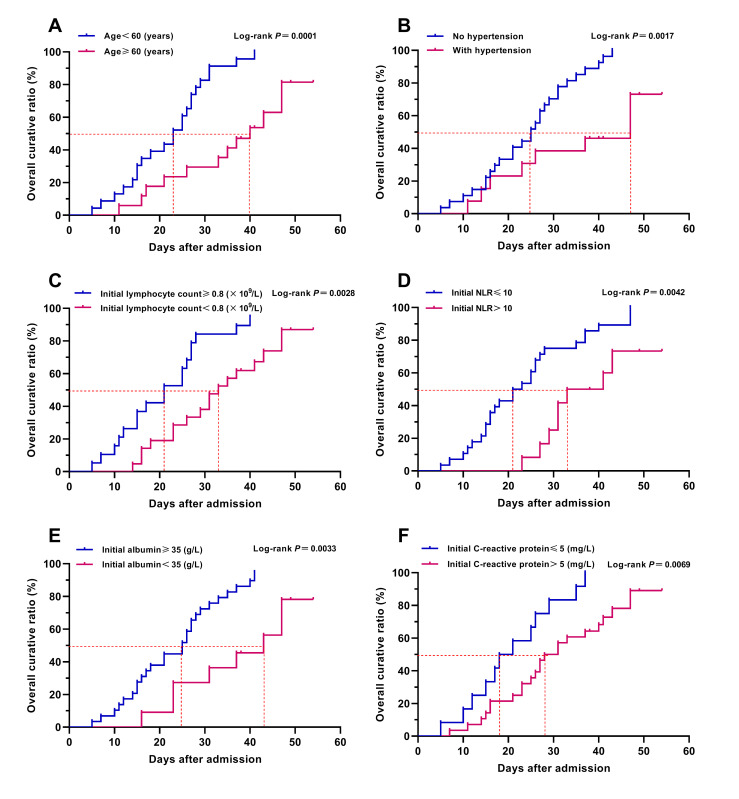
Figure 3.
Kaplan-Meier survival analyses of major risk factors. Figure shows the Kaplan-Meier survival curves of age (Panel A), hypertension (Panel B), initial lymphocyte count (Panel C), initial NLR (Pane D), initial albumin (Panel E), and initial C-reactive protein (Panel F). Parameters of Kaplan-Meier survival analysis: events: discharge or death; time to events: time from hospital admission to discharge or death. Overall curative ratio was calculated by the number of discharged patients.

