Figure 2.

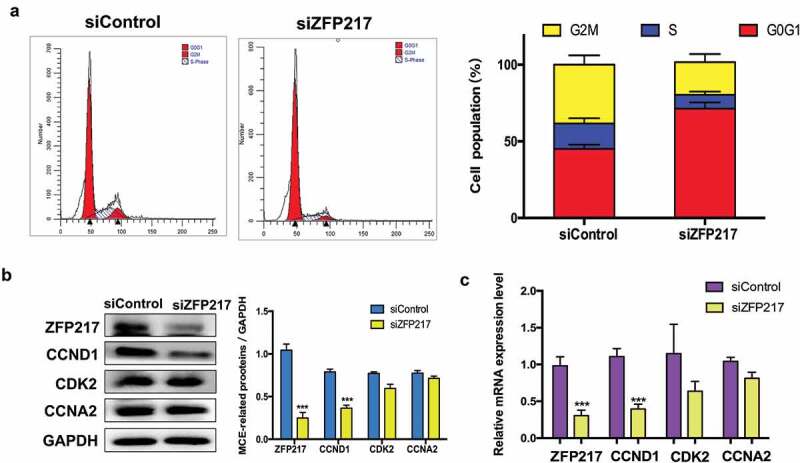
ZFP217 knockdown induced cell-cycle arrest in G0G1 phase.
(a) Flow cytometry analysis of cell-cycle progression of control and ZFP217-depleted cells. Cells were harvested at 24 h after MDI initiated and stained. The percentages of cells in the G1, S and G2 phase were calculated using ModFit LT software. (b) Cell lysates were obtained after 24 h of induction and subjected to Western blot analyses using the corresponding antibodies. The right panel shows the relative protein levels quantified by densitometry and normalized to GAPDH. (c) The MCE-related genes mRNA expression was analysed using qPCR. The data are presented as the mean ± SD of triplicate tests. *P< 0.05, **P< 0.01, ***P< 0.001 compared to the control group.
