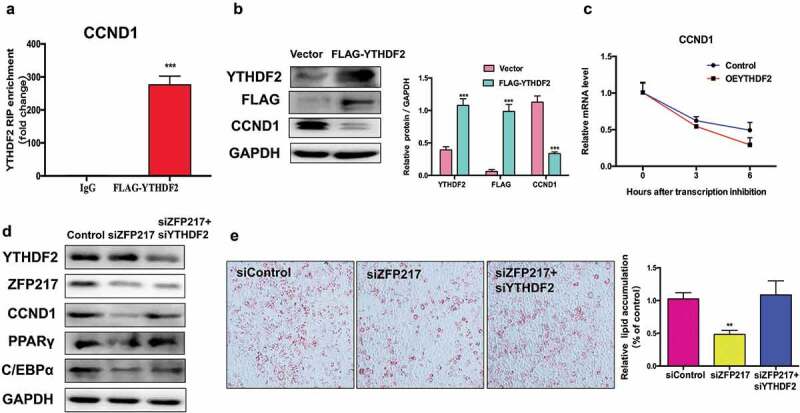
Figure 5.

CCND1 is a target of YTHDF2 which could influence mRNA stability.
(a) RIP analysis of the interaction of CCND1 with FLAG in 3T3-L1 cells transfected with control or YTHDF2-FLAG. Enrichment of CCND1 with FLAG was measured by qPCR and normalized to input. (b) Western blot analysis of FLAG and YTHDF2 in cells transfected with control and YTHDF2-FLAG plasmid. The right panel shows the relative protein levels quantified by densitometry and normalized to GAPDH. (c) Lifespans of CCND1 expression in cells transfected with the YTHDF2 overexpression plasmid compared with those of cells transfected with empty vector. Relative mRNA levels quantified by qPCR. (d) Western blot analysis of CCND1 in control, ZFP217 knockdown or YTHDF2 knockdown cells after MDI-induced for 24 h. The right panel shows the relative protein levels quantified by densitometry and normalized to GAPDH. (e) ORO staining of control, ZFP217 knockdown and ZFP217+ YTHDF2 knockdown cells after MDI-induced for 8 days. The data are presented as the mean ± SD of triplicate tests. *P< 0.05, **P< 0.01, ***P< 0.001 compared to the control group.
