
Figure 1.
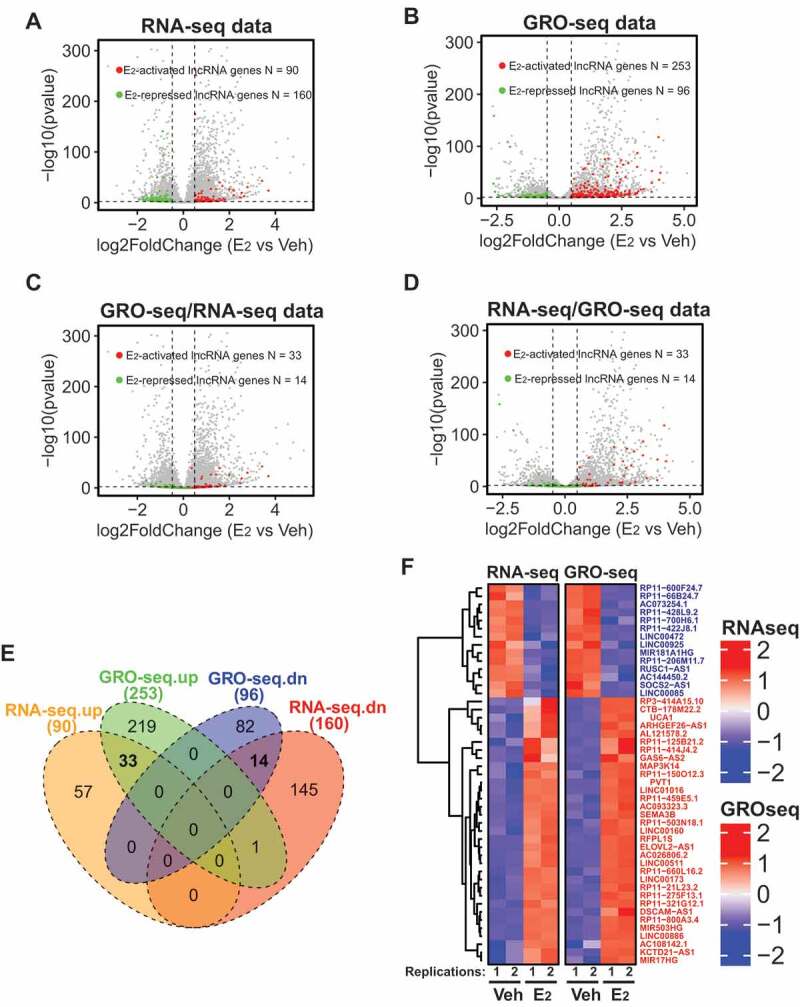
Identification of lncRNAs transcriptionally induced/repressed by oestrogen signalling in ER+ breast cancer cells.
A-B. Volcano plots showing the differential expression of lncRNAs upon E2 stimulation in MCF7 cells detected by RNA-seq (A) or GRO-seq (B). C-D. The differential expression oflncRNAs detected by GRO-seq were re-mapped for their expression changes using RNA-seq data (C) or vice versa (D). In all panels, each dot represents one gene. The green dots are lncRNAs that are significantly downregulated by E2. The red dots are lncRNAs upregulated by E2. E. Venn diagram showing the overlap of the lncRNAs withdifferential E2 responsiveness detected by either RNA-seq or GRO-seq. F. Heatmap of all the E2-actived orE2-repressed lncRNAs that could be detected by both RNA-seq and GRO-seq. From all the analyses in C-F, 33 E2-actived lncRNAs and 14 E2-repressed lncRNAs were identified and their gene names were listed in F.