
Fig. 7.
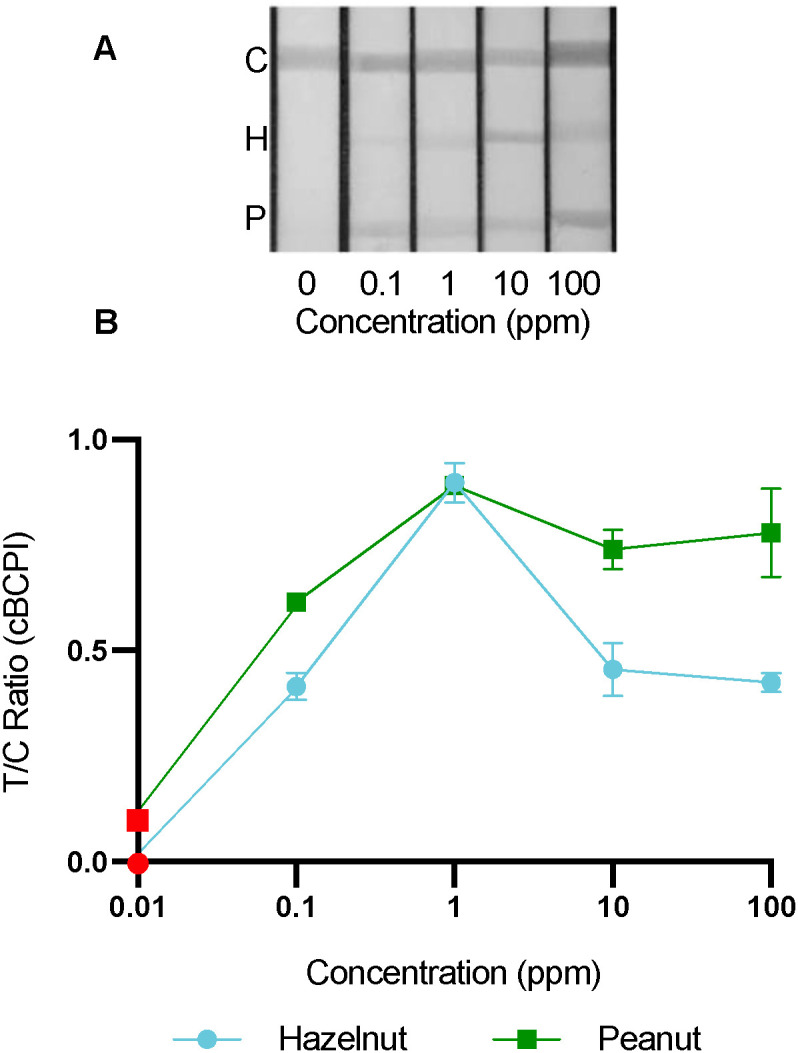
Photographs and calibration curves showing multiplex LFIA signal development in increasing concentration of incurred multi-allergen analyte where error bars represent standard deviation (n = 3). (A) Multiplex calibration range for sample type D2 (i.e., hazelnut cookie and peanut cookie spiked into blank cookie 0.1–100 ppm (w/w)) where C denotes the control line, H the hazelnut test line and P the peanut test line. (B) Calibration curve as a function of the T/C ratio (i.e., test line intensity divided by control line intensity) using corrected blue channel pixel intensities. The red circle represents the T/C ratio in a blank (0 ppm) sample. (For interpretation of the references to color in this figure legend, the reader is referred to the Web version of this article.)