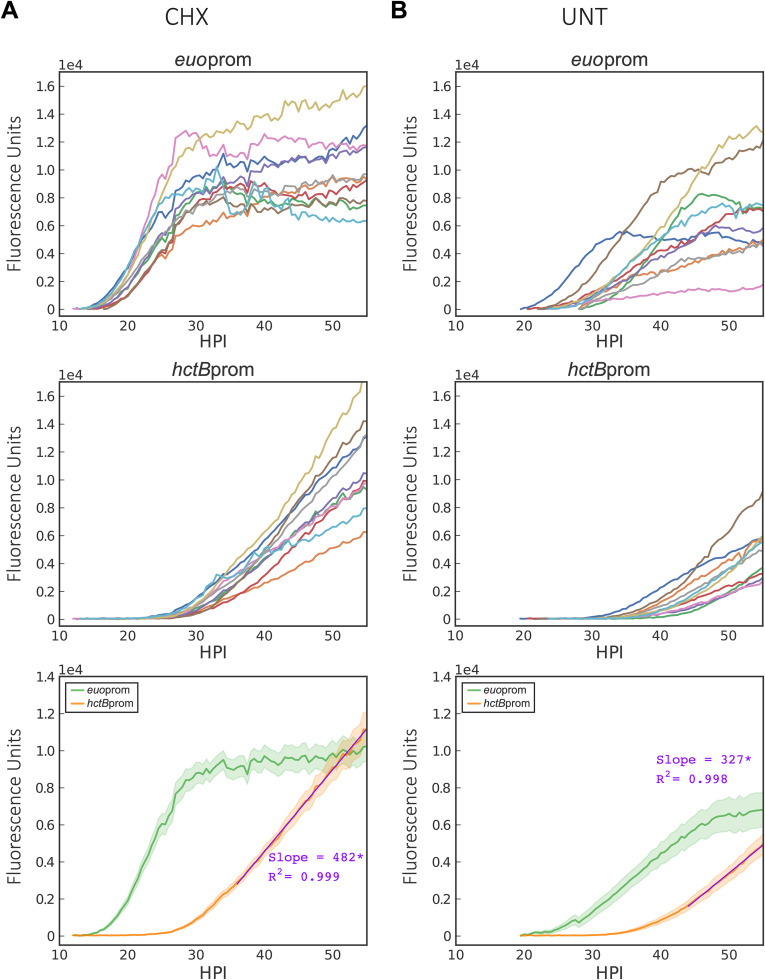
FIG 10.
Effect of cycloheximide on growth rate and EB production. Cos-7 cells were either treated with cycloheximide or vehicle only upon infection with Ctr-hctBprom-mKate2/euoprom-Clover. (A) Individual inclusion traces and averages of euoprom-Clover (RB) and hctBprom-mKate2 (EB) expression intensities monitored via automated live-cell fluorescence microscopy for cycloheximide (CHX)-treated infections. (B) Individual inclusion traces and averages of euoprom-Clover (RB) and hctBprom-mKate2 (EB) expression intensities monitored via automated live-cell fluorescence microscopy for vehicle (UNT)-treated infections. Purple lines are linear regression fits. Asterisks denote P value of <0.05. The cloud represents SEM. y axes are denoted in scientific notation.

