FIG 2.
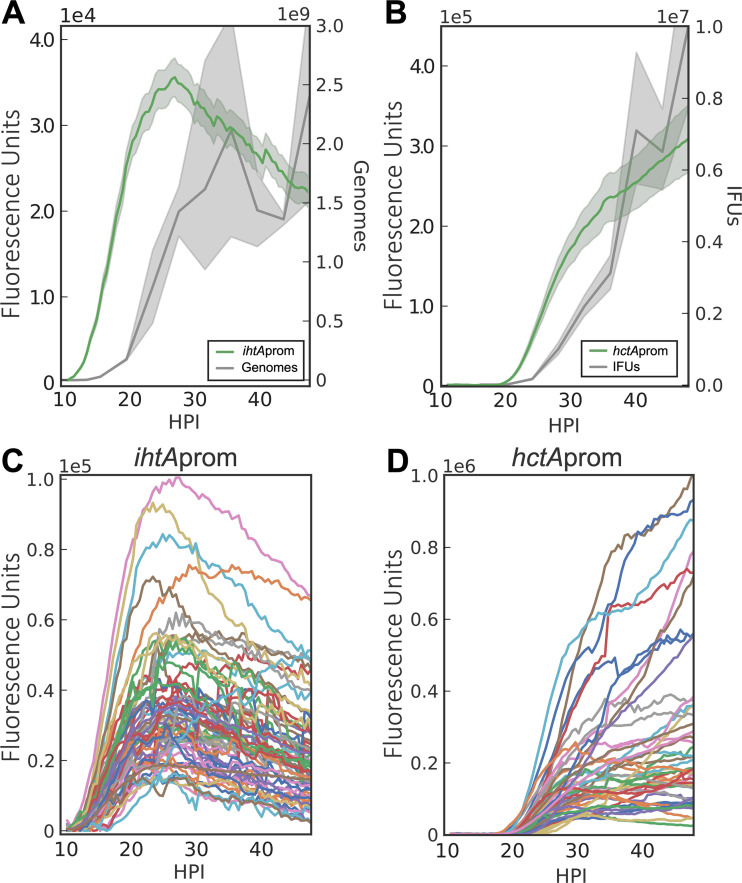
Live-cell fluorescent imaging of chlamydial development. Cell type-specific fluorescent reporters were created to track chlamydial development in real time. Infections with purified Ctr-L2-prom EBs were synchronized and fluorescence microscopy, and qPCR/reinfection assays were run simultaneously. (A and B) The averages of ihtAprom-EGFP and hctAprom-Clover expression intensities from >50 individual inclusions monitored via automated live-cell fluorescence microscopy throughout the developmental cycle compared to genome copies and IFU, respectively. (C and D) The fluorescence intensities of >50 individual inclusions tracked via live-cell microscopy throughout the developmental cycle. The fluorescent unit cloud represents standard error of the mean (SEM) genome copies, and the IFU cloud represents 95% confidence intervals (CI). y axes are denoted in scientific notation.

