
Fig. 5. 3D representation of iDISCO+ CP27 overlaid with significant volume reduction in the left hemisphere of the mouse brain.
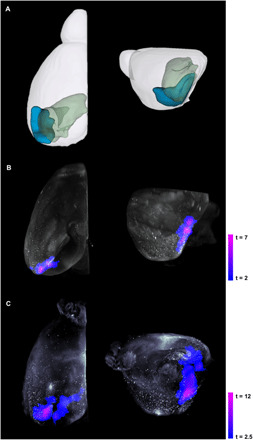
(A) Representative model of the left hemisphere of the mouse brain with the EC (LEC and MEC) in blue and the hippocampus (DG, CA1, CA2, CA3, and dhc; subicular complex: Sub, PPS, and Post) in green. iDISCO+ CP27 (white), which stains all human tau, was coregistered with TBM-related atrophy at (B) the early stage and (C) the moderate stage. Each panel shows the top view (left) and left hemisphere (right) of the mouse brain. Voxel-based analyses were conducted using a general linear model in SPM, and individual genotypes at each stage were contrasted using two-sample Student’s t test. Statistics are represented as heatmaps of t values corresponding to voxel-level P < 0.005 and cluster-level P < 0.05.