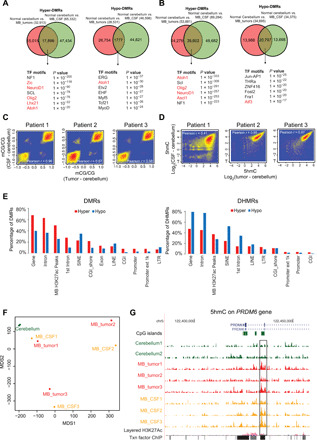
Fig. 2. DNA modification changes in both MB tumors and MB CSF compared to normal cerebellum.

(A) Top: Venn diagrams of the number of hyper-DMRs (left) or hypo-DMRs (right) identified between cerebellum and MB tumor and between cerebellum and MB CSF. Bottom: Lists of transcription factor (TF) motifs that were enriched within shared hyper-DMRs (left) or hypo-DMRs (right). (B) The same analysis as described in (A) but for hydroxymethylation. (C and D) Scatter plots showing the correlation of differences in 5mC (C) or 5hmC (D) between the normal cerebellum and MB tumor and between cerebellum and MB CSF ctDNA. (E) The genome distributions of shared hyper-DMRs (red) and hypo-DMRs (blue) identified in (A) (left), shared hyper-DHMRs (red) and hypo-DHMRs (blue) identified in (B) (right). The y axes report the percentages of the DMRs or DHMRs relative to all DMRs or DHMRs, respectively. LINE, long interspersed nuclear element; SINE, short interspersed nuclear elements; LTR, long terminal repeat. (F) Multidimensional scaling (MDS) analysis of the 5hmC signals in the shared DHMRs identified in (B). (G) University of California, Santa Cruz (UCSC) genome browser view of 5hmC enrichment at the PRDM6 locus (chr5: 122,433,516 to 122,435,744) in cerebellum, MB tumor, and MB CSF ctDNA. The highlighted region exhibits increased 5hmC in both MB tumor and MB CSF samples.
