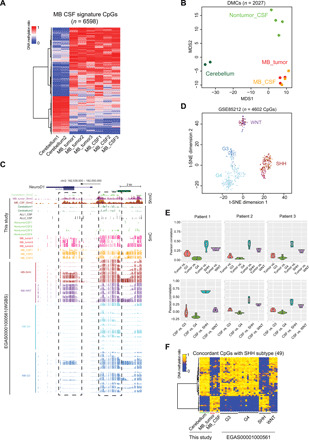
Fig. 3. MB DNA methylation signatures in CSF ctDNA for cancer diagnosis.

(A) Heatmap representation of DNA methylation levels at MB CSF signature CpGs (n = 6598). (B) MDS analysis of the DNA methylation levels at MB CSF signature CpGs detected in cerebellum (dark green), MB tumor (red), MB CSF (orange), and nontumor CSF (light green). (C) UCSC genome browser view of DNA methylation and hydroxymethylation levels at the NEUROD1 locus (chr2: 182,539,000 to 182,550,000) in the indicated samples. (D) t-distributed stochastic neighbor embedding (t-SNE) analysis of the DNA methylation levels of the common CpG sites between MB CSF signature CpGs and the published DNA methylation array data from approximately 600 patients with MB (8). WNT, purple; SHH, maroon; group 3 (G3), dark blue; group 4 (G4), light blue. (E) Pearson correlation analysis of DNA methylation status of the common CpGs between MB CSF signature CpGs and subtype-specific CpGs identified from public data (20) (n = 1047 CpGs). Top: The methylation status in MB tumor samples. Bottom: the methylation status in MB CSF samples. (F) Heatmap representation of the selected 49 subtype-specific CpGs (of 1047 CpG sites), which exhibited concordant DNA methylation status between the three SHH-subtype MB CSF and MB tumor samples (this study) and public MB tumors data.
