
Fig. 1. Climatology and proxy locations.
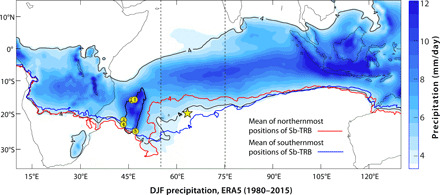
Spatial pattern of December, January, and February (DJF) mean precipitation amount (millimeters per day) (shaded) between 1980 and 2015 from the European Centre for Medium-Range Weather Forecasts Reanalysis fifth-generation (ERA5) precipitation data. The climatological mean location of the southern boundary of the tropical rain belt (Sb-TRB) is indicated by the 4 mm/day isohyet (black). The precipitation amount of less than 4 mm/day is masked for clarity. The mean latitudinal positions of the northernmost and the southernmost Sb-TRB (4 mm/day isohyet) between 55°E and 75°E (dashed vertical lines) and 10°S to 25°S are shown by the red and blue isohyets, respectively (see Materials and Methods). Locations of Rodrigues (star) and other proxy records (yellow circles with numbers) (also see fig. S1) are marked as follows: 1, Anjohibe and Anjokipoty caves (10, 26–29); 2, Lake Mitsinjo (25); 3, Lake Ihotry (20); 4, Lake Andolonomby (23); and 5, Ste-Luce peat bog cores (12).