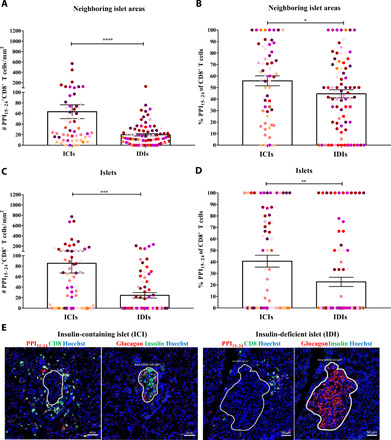
Fig. 4. PPI15–24-specific CD8+ T cells infiltration or retention in the islets depends on the presence of insulin.

Insulin-containing islets (ICIs; n = 69) and insulin-deficient islets (IDIs; n = 87) from donors with T1D (n = 11) were analyzed for the presence of PPI15–24-specific CD8+ T cells. (A) A higher density (P < 0.0001) and (B) frequency (P = 0.045) of PPI15–24+CD8+ T cells was detected in close proximity to ICIs (n = 56) compared to IDIs (n = 81). The number (P = 0.0002) and percentage (P = 0.003) of PPI15–24+CD8+ T cells are increased in ICIs compared to IDIs. (A and B) Every dot represents a neighboring islet area (n = 267) or (C and D) an islet (n = 302). Bars represent the mean ± SEM numbers (A and C) and frequencies (B and D) of PPI15–24+CD8+ T cells per square millimeter. Every color represents a donor. For statistical analysis, the Mann-Whitney test was used to determine significance: *P = 0.05, **P < 0.05, ***P < 0.001, and ****P < 0.0001. (E) Representative immunofluorescence images of an ICI and IDI from a donor (#6052) with T1D (1 year of disease duration). PPI15–24-specific CD8+ T cells are shown in yellow.
