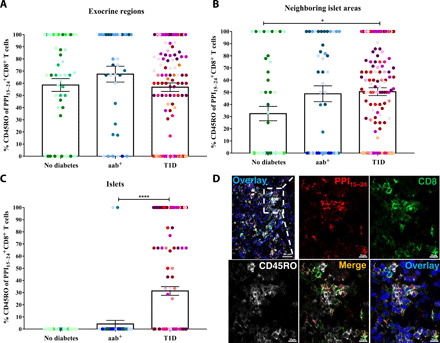
Fig. 5. Most PPI15–24-specific CD8+ T cells are memory cells.

The percentages of CD45RO+ cells of PPI15–24-specific CD8+ T cells are shown for (A) exocrine regions (no diabetes, n = 59; aab+, n = 36; T1D, n = 123), (B) neighboring islet areas (no diabetes, n = 48; aab+, n = 44; T1D, n = 126), and (C) islets (no diabetes, n = 53; aab+, n = 48; T1D, n = 143). Bars represent the mean ± SEM percentages of PPI15–24-specific CD8+ CD45RO+ T cells per square millimeter for each group. Every dot represents a region or an islet. Every color represents a donor. For statistical analysis, nonparametric Kruskal-Wallis test followed by Dunn multiple comparison test was used to determine significance: *P = 0.05 and ****P < 0.0001. (D) Immunofluorescence images of PPI15–24-specific CD8+ T cells, including the CD45RO memory marker of a pancreas section from a donor with T1D (#6052, 1 year of disease duration). The image demonstrates an islet (complementary to Fig. 4E). Scale bar, 10 μm for images with higher magnification.
