
Fig. 2. Thermal and olfactory events: Subjective unpleasantness.
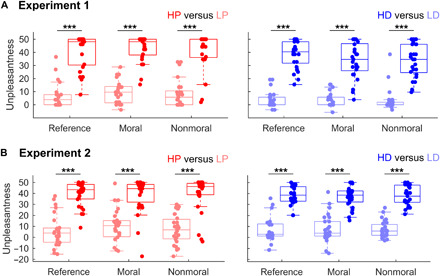
Ratings for thermal (left) and olfactory (right) stimuli in reference trials, as well as trials following moral and nonmoral dilemmas, in experiment 1 (A) and in experiment 2 (B). Data from 25 subjects for experiment 1 and 27 subjects for experiment 2. Red boxplots refer to thermal stimulations, whereas blue boxplots refer to olfactory events. Darker colors refer to unpleasant conditions (HP and HD), whereas lighter tones refer to neutral controls (LP and LD). Each boxplot describes the median value (central mark), the interquartile range (boxes’ edges), and the extreme points of the distribution (whiskers) without considering outliers. Single-subject data points are also plotted over each boxplot as colored circles. “***” refers to P < 0.001 in a linear mixed model probing differential responses across conditions.