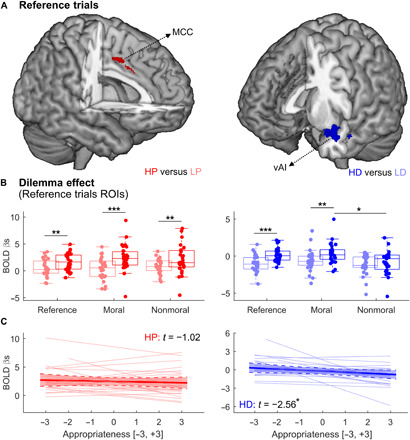
Fig. 4. Thermal and olfactory events: Neural responses.

(A) Whole-brain maps displaying differential response to HP-LP (left) and HD-LD (right) in reference trials. (B) Signal associated with thermal (left) and olfactory (right) stimuli in reference trials, as well as trials following moral and nonmoral dilemmas. Individual responses were calculated by averaging the parameter estimates (βs) from the MCC (left) and vAI (right) in the analysis of reference trials. Each boxplot describes the median value (central mark), the interquartile range (boxes’ edges), and the extreme points of the distribution (whiskers) without considering outliers. Single-subject data points are also plotted over each boxplot as colored circles. “***,” “**,” and “*” refer to P < 0.001, P < 0.01, and P < 0.05, respectively, for a generalized linear mixed model test probing differential responses across conditions. (C) Multilevel regression describing the relationship between neural activity to HP (left) and HD (right) and ratings of appropriateness from an independent validation study (see Materials and Methods). Each plot shows a group-wise linear dependency (with a shaded area describing the 95% confidence interval), overlaid by individual regression dotted lines. The t scores of the multilevel regression are also displayed, with “*” referring to significance at P < 0.05. BOLD, blood-oxygen-level dependent signal.
