. 2020 Oct 16;9:e55542. doi: 10.7554/eLife.55542

Figure 4. V2 suppresses the AGO4-dependent methylation of viral DNA.

(A) Percentage of methylated cytosines in the intergenic region (IR) of TYLCV in local infection assays with TYLCV wild-type or V2 null mutant (TYLCV-V2null) in N. benthamiana at 3 or 9 days post-inoculation (dpi), as detected by bisulfite sequencing. The original single-base resolution bisulfite sequencing data are shown in Figure 4—figure supplement 1A. Values are the mean of three independent biological replicates; error bars indicate SEM. Asterisks indicate a statistically significant difference according to Student’s t-test. ***: p<0.001. The values of cytosine methylation in each biological replicate are shown in Supplementary file 1. (B) Percentage of methylated cytosines in the intergenic region (IR) of TYLCV in local infection assays with the V2 null mutant TYLCV (TYLCV-V2null) in AGO4-silenced (TRV-NbAGO4) or control (TRV-EV) N. benthamiana plants at 4 dpi, as detected by bisulfite sequencing. Samples come from the same plants used in Figure 3E. The original single-base resolution bisulfite sequencing data are shown in Figure 4—figure supplement 1B. Values are the mean of four independent biological replicates; error bars indicate SEM. Asterisks indicate a statistically significant difference according to Student’s t-test. *: p<0.05. The values of cytosine methylation in each biological replicate are shown in Supplementary file 1. (C) Percentage of methylated cytosines in the intergenic region (IR) of TYLCV in systemic infection assays with TYLCV wild-type or V2 null mutant (TYLCV-V2null) in AGO4-silenced (TRV-NbAGO4) or control (TRV-EV) N. benthamiana plants at 3 weeks post-inoculation (wpi), as detected by bisulfite sequencing. Samples come from the same plants used in Figure 3F. The original single-base resolution bisulfite sequencing data are shown in Figure 4—figure supplement 2. Values are the mean of four independent biological replicates; error bars indicate SEM. Asterisks indicate a statistically significant difference according to Student’s t-test. *: p<0.05. The values of cytosine methylation in each biological replicate are shown in Supplementary file 1.

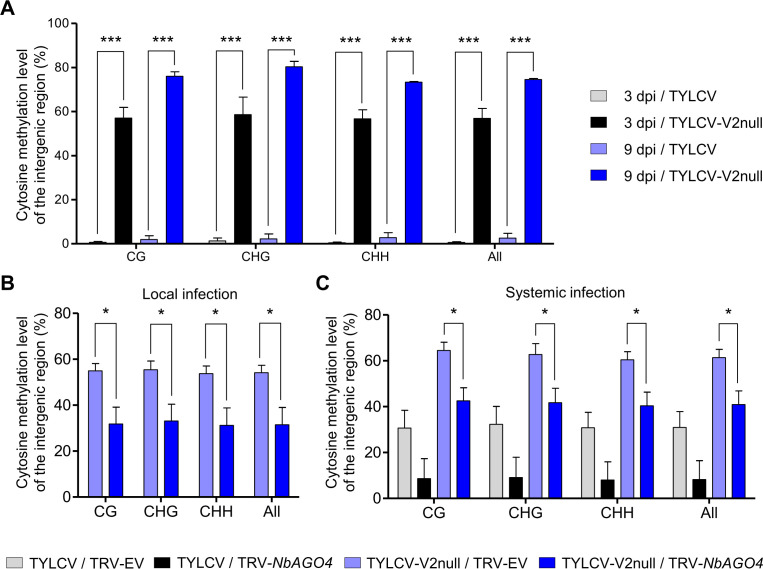
Figure 4.

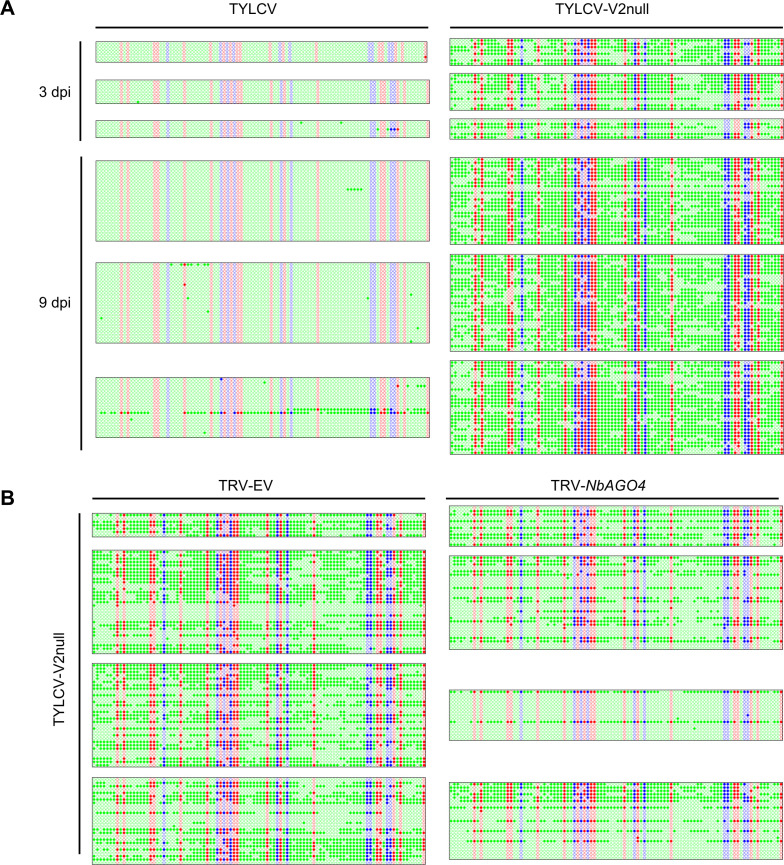
Figure 4—figure supplement 1. Original single-base resolution bisulfite sequencing data of the intergenic region (IR) of TYLCV (wild-type and V2 null mutant) in local infection assays, related to Figure 4A,B.

Figure 4—figure supplement 1.

(A) Original single-base resolution bisulfite sequencing data for Figure 4A. At least five individual clones were sequenced per replicate and sample at 3 dpi, and >18 individual were sequenced per replicate and sample at 9 dpi. Each single circle, corresponding to a cytosine, is colored in blue, red, or green, representing the CHG, CG, or CHH contexts, respectively. Methylated cytosines are represented by filled circles, while unmethylated cytosines are represented by empty circles. Values of IR methylation in independent biological replicates is shown in Supplementary file 1. (B) Original single-base resolution bisulfite sequencing data for Figure 4B. At least seven individual clones were sequenced per sample at 4 dpi in the first replicate, and >15 individual clones were sequenced per sample at 4 dpi in replicates second to fourth. Each single circle, corresponding to a cytosine, is colored in blue, red, or green, representing the CHG, CG, or CHH contexts, respectively. Methylated cytosines are represented by filled circles, while unmethylated cytosines are represented by empty circles. Values of IR methylation in independent biological replicates are shown in Supplementary file 1.
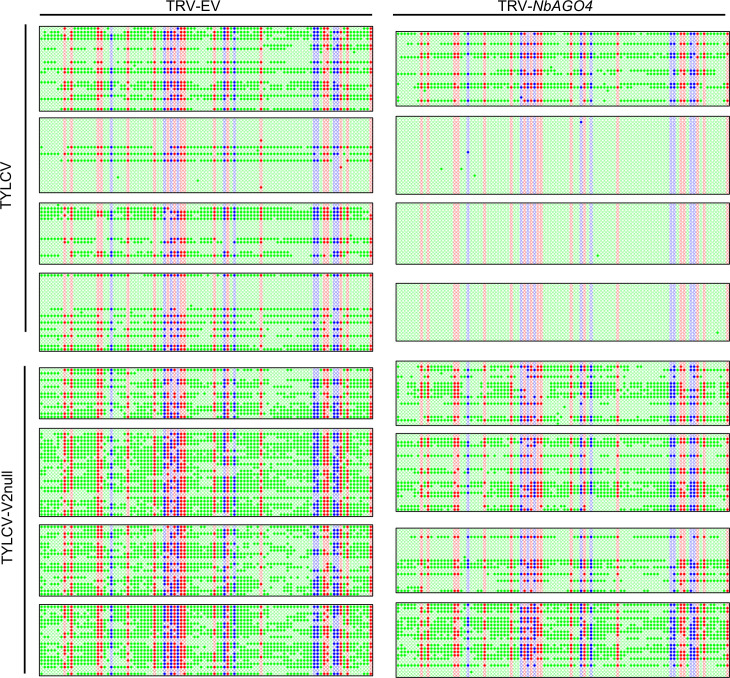
Figure 4—figure supplement 2. Original single-base resolution bisulfite sequencing data of the intergenic region (IR) of TYLCV and TYLCV-V2null in systemic infection assays, related to Figure 4C.

Figure 4—figure supplement 2.

Original single-base resolution bisulfite sequencing data for Figure 4C. >14 individual clones were sequenced per sample and replicate. Each single circle, corresponding to a cytosine, is colored in blue, red, or green, representing the CHG, CG, or CHH contexts, respectively. Methylated cytosines are represented by filled circles, while unmethylated cytosines are represented by empty circles. Values of IR methylation in independent biological replicates are shown in Supplementary file 1.