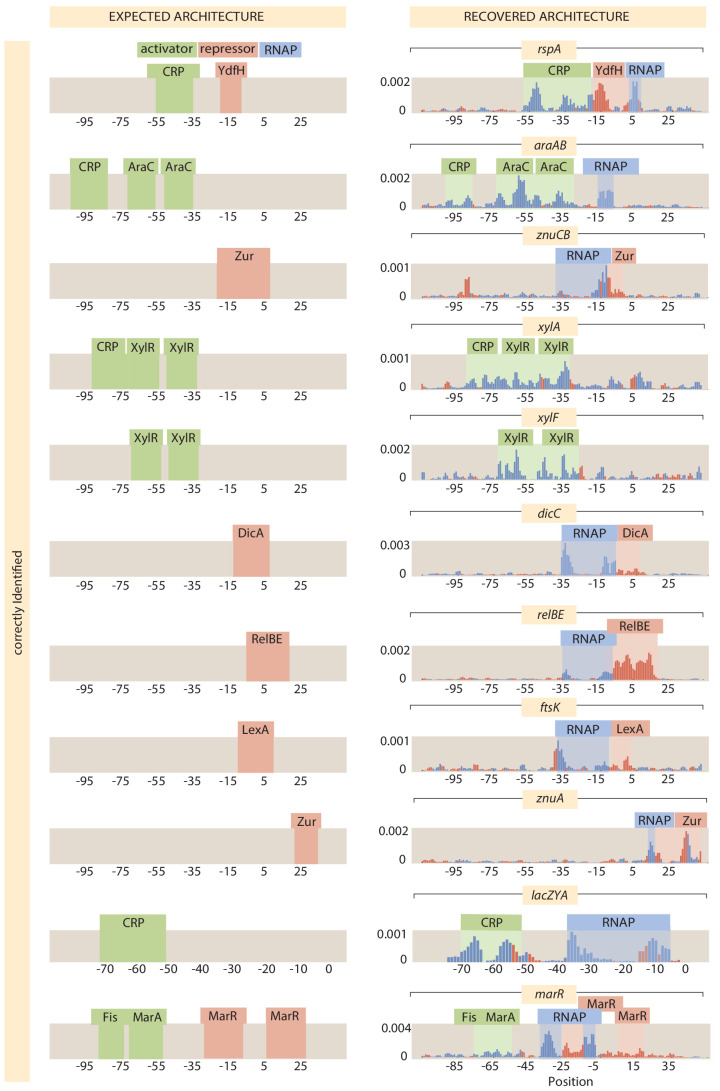
Appendix 2—figure 2. A visual comparison of the literature binding sites (left panel) and the extent of the binding sites discovered by our algorithmic approach (right panel).
RNAP-binding sites are also labeled in the right panel, but RNAP-binding sites are not included in the false positive analysis. Numeric values for the displayed data can be found in Appendix 2—figure 2—source data 1.

