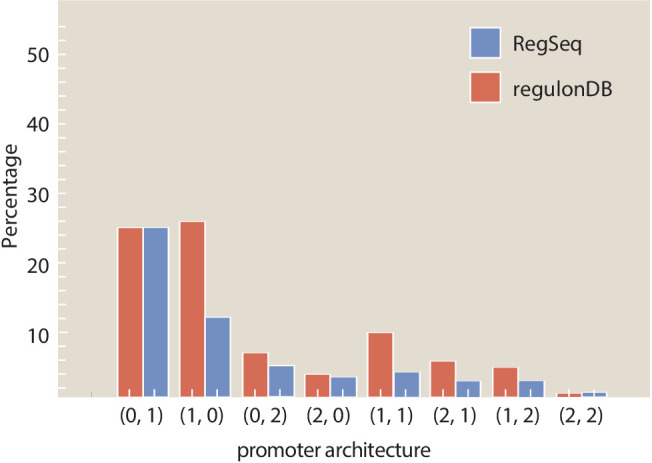
Appendix 4—figure 2. A comparison of the types of architectures found in RegulonDB (Santos-Zavaleta et al., 2019) to the architectures with newly discovered binding sites found in the Reg-Seq study.

For each type of architecture, labeled as (number of activators, number of repressors), the fraction that architecture comprises of the total number of operons is given both for the data found in RegulonDB and from the results of the Reg-Seq experiment. Numeric values for the displayed data can be found in Appendix 4—figure 2—source data 1.
