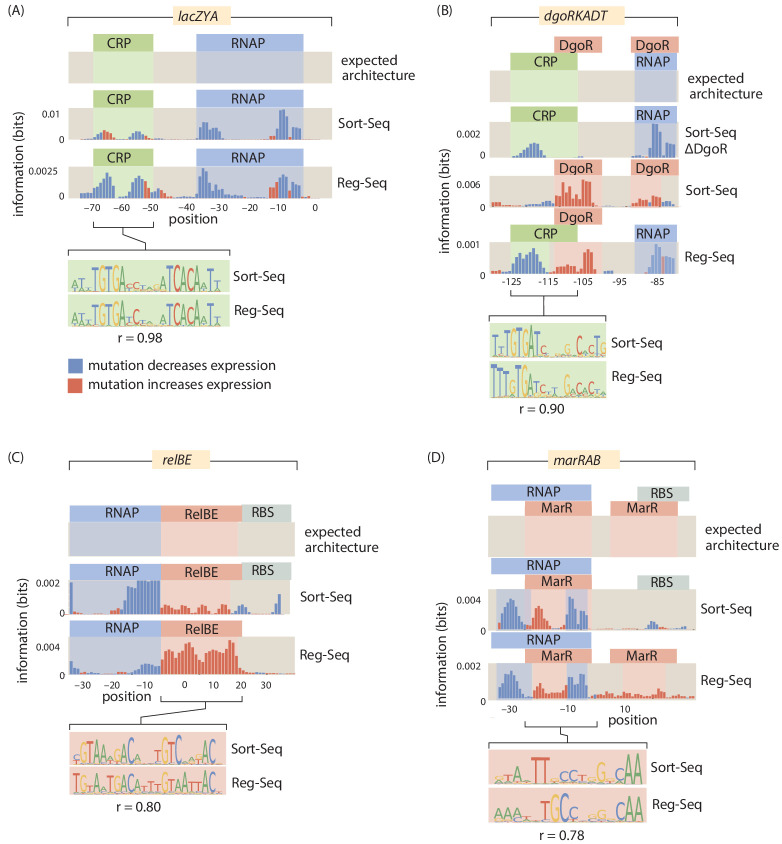
Figure 3. A summary of four direct comparisons of measurements from Sort-Seq and Reg-Seq.
We show the identified regulatory regions as well as quantitative comparisons between inferred position weight matrices. (A) CRP binds upstream of RNAP in the lacZYA promoter. Despite the different measurement techniques for the two inferred position weight matrices, the CRP-binding sites have a Pearson correlation coefficient of . (B) The dgoRKADT promoter is activated by CRP in the presence of galactonate and is repressed by DgoR. For Sort-Seq and Reg-Seq, type II activator-binding sites can be identified based on the signals in the information footprint in the area indicated in green. Additionally, the quantitative agreement between the CRP position weight matrices are strong, with . (C) The relBE promoter is repressed by RelBE as can be identified algorithmically in both Sort-Seq and Reg-Seq. The inferred logos for the two measurement methods have . (D) The marRAB promoter is repressed by MarR. The inferred energy matrices (data not shown) and sequence logos shown have . The right most MarR site overlaps with a ribosome-binding site. The overlap has a stronger obscuring effect on the sequence specificity of the Sort-Seq measurement, which measures protein levels directly, than it does on the output of the Reg-Seq measurement. Numeric values for the displayed data can be found in Figure 3—source data 1.

