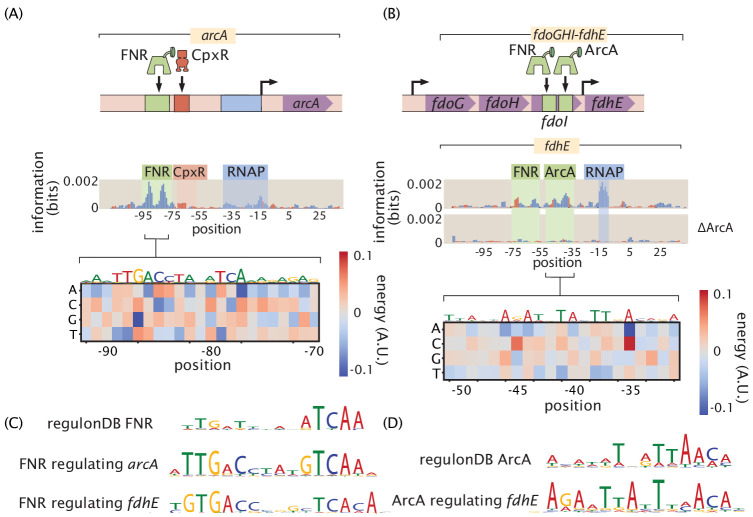
Figure 9. Inspection of a genetic circuit.
(A) Here, the information footprint of the arcA promoter is displayed along with the energy matrix describing the discovered FNR-binding site. (B) Intra-operon regulation of fdhE by both FNR and ArcA. The information footprint of fdhE is displayed. The discovered sites for FNR and ArcA are highlighted and the energy matrix for ArcA is displayed. A TOMTOM (Gupta et al., 2007) search of the binding motif found that ArcA was the most likely candidate for the transcription factor. The displayed information footprint from a knockout of ArcA demonstrates that the binding signature of the site, and its associated RNAP site, are no longer determinants of gene expression. (C) Sequence logos for FNR generated from both the sites cataloged in RegulonDB, as well as the discovered sites regulating arcA and fdhE. (D) Sequence logos for ArcA from sites contained in RegulonDB and the ArcA site regulating fdhE. Numeric values for the binding locations can be found in Figure 9—source data 1.

