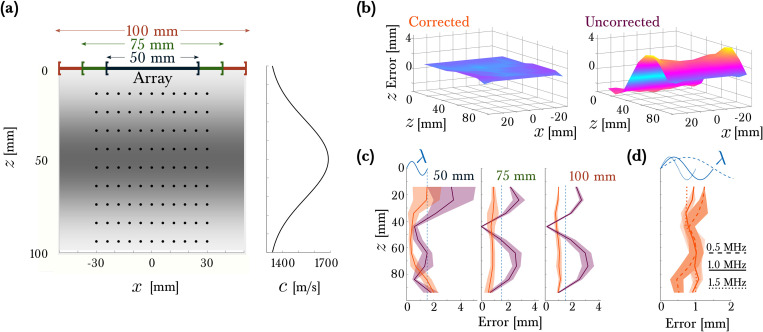
Fig. 2.
(Color online) Source localization improvement with phase correction. (a) Arrangement of sources (black circles) relative to the virtual sensor array and stratified sound speed (grayscale and plot at right). Note z-direction is downward. (b) Axial error error with the phase corrections (left) and without (right). (c) Mean (line) and standard deviation (shaded region) of the errors at each depth z averaged over all transverse positions x for the corrected and uncorrected cases with the indicated aperture. For reference, the wavelength of the 1 MHz signal is indicated at the dotted line. (d) Depth dependent errors for a 100 mm aperture for the indicated center frequencies, compared with the associated wavelengths.

