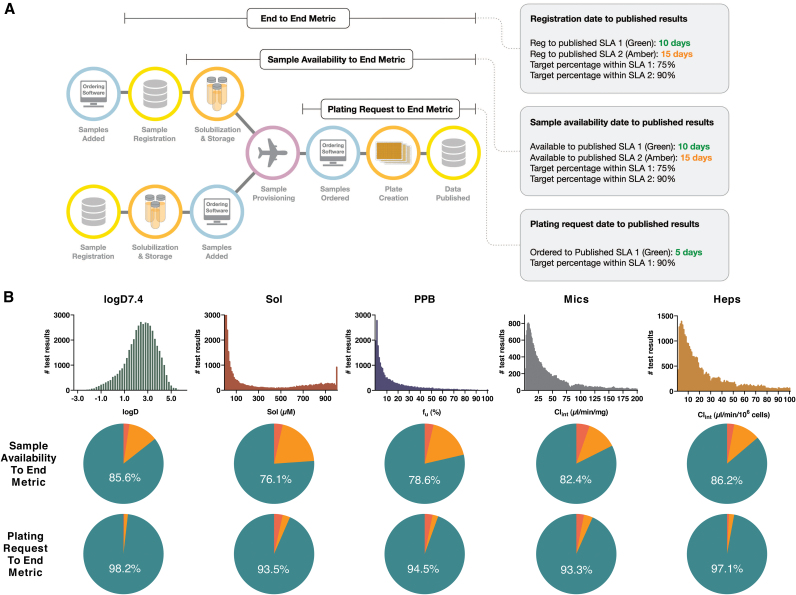
Fig. 7.
(A) Schematic illustration of internal metrics designed to measure times from registration of samples to the appearance of experimental data in internal databases (SLA). Measurements include the full “End to End Metric”—starting with sample registration, “Sample Availability to End Metric”—starting from when a physical sample becomes available at a global sample management facility (probing shipping efficiency and assay performance) and “Plating Request to End Metric”—from ordering of locally available compounds to publication of assay results (probing assay performance). (B) Top—Histograms of panel results since the start of operations in 2013 through to May 2019. Mid–pie charts illustrating number of days from samples being physically available at a Sample Management site to published data in database (combined statistics from 2018 and 2019). Green <10 days, orange <15 days and red if outside of SLA. Bottom—corresponding pie charts for the number of days from plating request to published data. Green <5 days, orange <10 days and red if outside of SLA. SLA, Service Level Agreement. Color images are available online.

