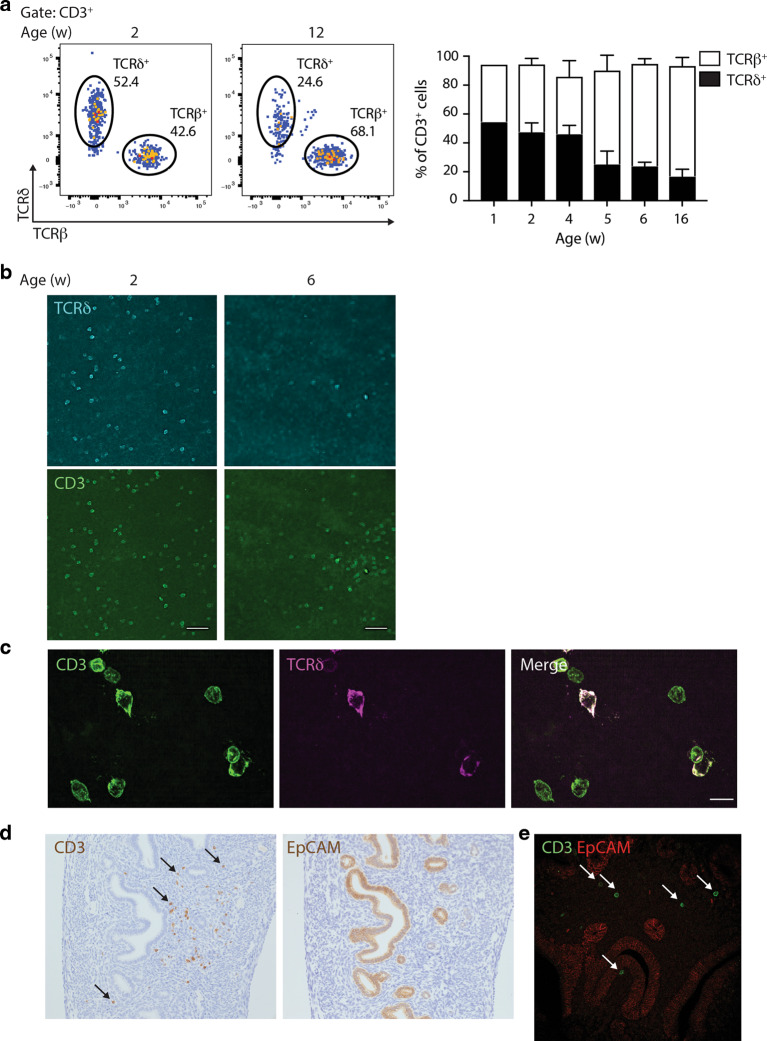
Fig. 1. A major uterine γδ T-cell compartment, particularly in early life.
a Left: Flow cytometry of CD3+ lymphocytes from the uterus of 2- and 12-week-old C57BL/6J mice. Representative plots are shown. Right: Uterine T-cell kinetics; the percentages of TCRδ+ and TCRβ+ cells (out of CD3+ cells) are indicated (n = 3–7 per condition; a pool of nine uteri is shown for 1-week-old mice). Data represent at least two independent experiments. Graph indicates mean ± SD. b CD3 and TCRδ staining were analysed by confocal microscopy on uterus whole-mounts of C57BL/6J mice of the indicated ages. Representative images from two independent experiments are shown (n = 3). Scale bars: 50 μm. c High-resolution images of CD3 and TCRγδ staining were obtained by iSIM on uterus whole-mounts of 2-week-old C57BL/6J mice (n = 3). Scale bars: 10 μm. CD3-TCRδ co-staining appears as purple-white. d CD3 and EpCAM staining were analysed by immunohistochemistry on FFPE uterine serial sections. Arrows indicate the position of several CD3+ cells. Representative images from four independent samples are shown. e CD3 and EpCAM staining were analysed by confocal microscopy on uterus FFPE sections. Representative images are shown.

