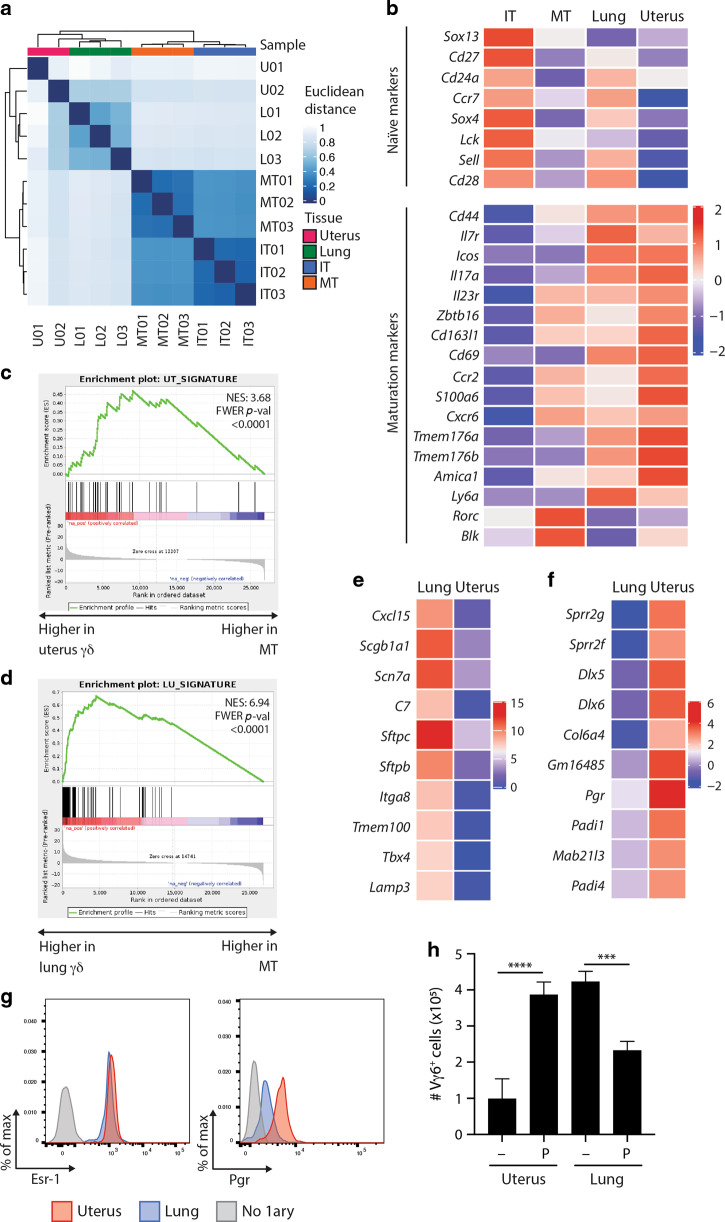
Fig. 3. Uterine and pulmonary γδ T cells adapt to sites of residence.
a Immature Vγ1−4−5− thymocytes (IT, CD24+CD44−), mature Vγ1−4−5− thymocytes (MT, CD24−CD44+), and pulmonary (L) and uterine (U) Vγ1−4−5− γδ T cells were sorted and gene expression determined via RNAseq (2–3 independent samples per condition). A Euclidean clustered distance matrix heatmap was generated using overall gene expression. Normalisation and variance-stabilising transformation (VST) were applied on raw counts before plotting. b Heat map of immaturity and maturation-associated marker expression across the RNAseq datasets. Changes in transcript abundance between conditions are shown with Z-scores computed on the mean of the samples variance-stabilising transformation (VST). c Gene set enrichment analysis (GSEA) for uterus signature genes was performed for differentially expressed genes between mature Vγ1−4−5− thymocytes and uterine Vγ1−4−5− γδ T cells. The enrichment score (NES) and p value are reported. Genes were ranked based on the Wald statistic resulting from the differential expression analysis. d Gene set enrichment analysis (GSEA) for lung signature genes was performed for differentially expressed genes between mature Vγ1−4−5− thymocytes and pulmonary Vγ1−4−5−γδ T cells. The enrichment score (NES) and p value are reported. Genes were ranked based on the Wald statistic resulting from the differential expression analysis. e Expression of the ten lung-specific genes most differentially expressed between uterine and pulmonary Vγ1−4−5− γδ T cells. Changes in transcript abundance between conditions are shown with Z-scores computed on the mean of the samples variance-stabilising transformation (VST). f Expression of the top ten uterus-specific genes most differentially expressed between uterine and pulmonary Vγ1−4−5− γδ T cells. Changes in transcript abundance between conditions are shown with Z-scores computed on the mean of the samples variance-stabilising transformation (VST). g Oestrogen receptor 1 (Esr-1) and progesterone receptor (Pgr) protein expression by lung (blue) and uterus (red) γδ T cells were determined by flow cytometry (n = 3). A negative control stained in the absence of primary antibody is shown in grey. Representative data from two experiments are shown. h Total numbers of Vγ6+ cells recovered from uterine or lung cell cultures following in vitro expansion in media optimised for γδ17 cells. When indicated, cultures were supplemented with progesterone (P) (n = 3). Graph indicates mean ± SD. Statistical significance was assessed by one-way ANOVA with Sidak’s multiple comparisons post-hoc test. ns not significant, ***p < 0.001, ****p < 0.0001.

