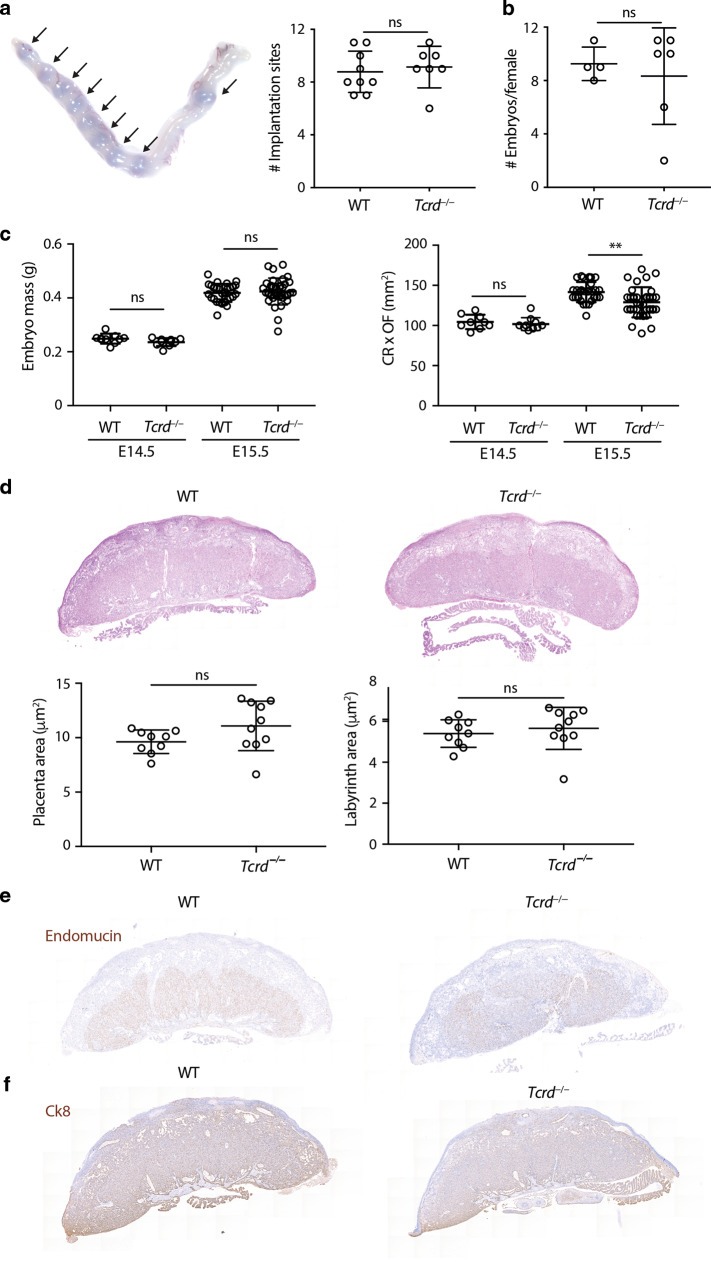
Fig. 6. Pregnancies of γδ T-cell-deficient mice appear normal.
WT or Tcrd−/− females from the FVB background were time-mated to C57BL/6J males. a (Left) Implantation rates were analysed by i.v. injection of Evans blue at E5.5. A representative image of a gravid uterus, with arrows indicating implantation sites, is shown. (Right) Number of implantation sites per female (n = 7–9). b Total number of embryos per pregnant female at E14.5 and E15.5 (n = 4–6). c Embryo mass and size (CR crown-rump distance, OF occipito-frontal distance) were determined (E14.5: n = 9–10, E15.5: n = 28–34). d H&E staining of WT and Tcrd−/− placentas and quantification of placental and labyrinth area (n = 9–10). e Endomucin immunohistochemistry of WT and Tcrd−/− placentas. f Cytokeratin-8 (Ck8) immunohistochemistry of WT and Tcrd−/− placentas. All graphs indicate mean ± SD. Statistical significance was assessed by unpaired t-test (a, b, d) or one-way ANOVA with Tukey’s multiple comparisons post-hoc test (c). ns not significant, **p < 0.01.

