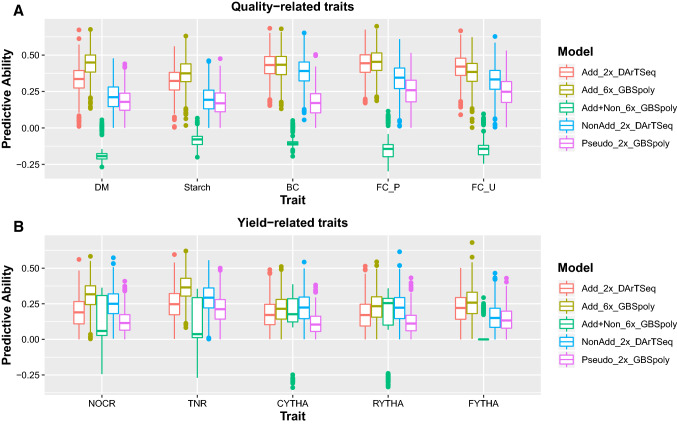
Fig. 4.
Model comparison in sweetpotato. Boxplots comparing predictive ability of additive-effects-only models without dosage (Add_2x_DArTseq) and with dosage (Add_6x_GBSpoly); models considering also non-additive effects (NonAdd_2x_DArTSeq; Add + Non_6x_GBSpoly); and pseudo-diploidized dosage data (Pseudo_2x_GBSpoly) for quality-related traits (A; DM = dry matter, starch, BC = β-carotene, FC_P = flesh color in Peru; FC_U = flesh color in Uganda); and yield-related traits (B; NOCR = number of commercial storage roots, TNR = total number of storage roots, CYTHA = weight of commercial storage roots, RYTHA = weight of total storage roots, FYTHA = total weight of foliage) in a full-sib family of sweetpotato

