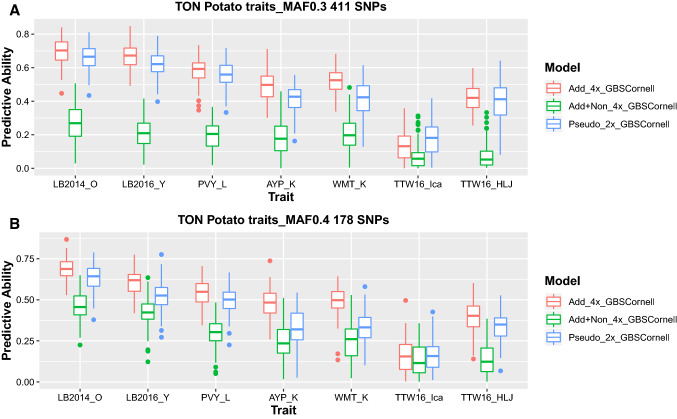
Fig. 5.
Model comparison in potato. Box plots comparing predictive ability of additive-effects-only model (Add_4x_GBSCornell); additive and non-additive effects (Add + Non_4x_GBSCornell); and pseudo-diploidized dosage data (Pseudo_2x_GBSCornell); using minimum allele frequency (MAF) ≥ 30% (A; 411 SNPs) and MAF ≥ 40% (B; 178 SNPs). LB2014_O = late blight in Oxapampa (Peru) in 2014, LB2016_Y = late blight in Yunnan (China) in 2016, PVY_L = potato virus Y in Lima (Peru), AYP_K = average yield per plant in Kunming (China), WMT_K = weight of marketable tubers in Kunming, TTW16_Ica = total tuber weight in Ica (Peru) in 2016 across three drought treatments, TTW16_HLJ = total tuber weight in Heilongjiang (China) in 2016, single treatment, in potato

