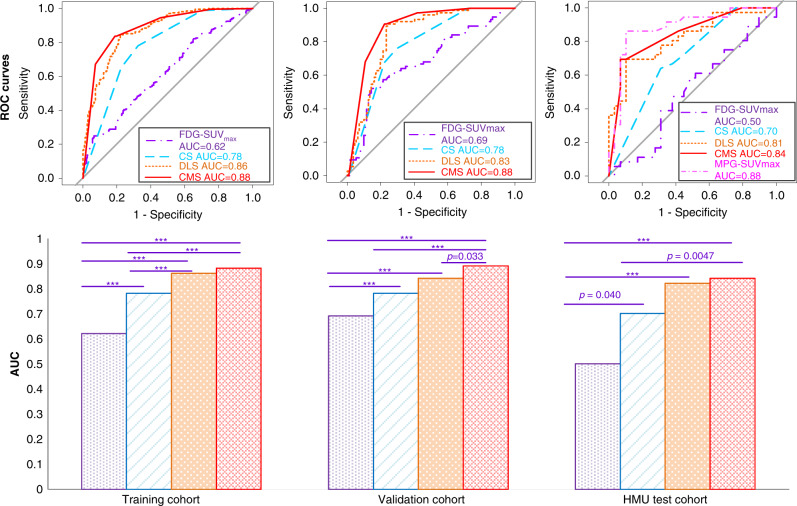
Fig. 2. Performance of the EGFR-DLS in predicting EGFR status across different cohorts.
The top row are the ROC curves of different models in the training, validation, and HMU test cohorts, respectively. The bottom row are the AUC values and the comparison results with Delong test. For statistical comparisons among different models, a two-sided Delong test was used. *** denotes a p value <0.001. If p value is otherwise, it is noted. Statistics for AUC, sensitivity, specificity, and accuracy for all cohorts are provided in Supplementary Table 1.

