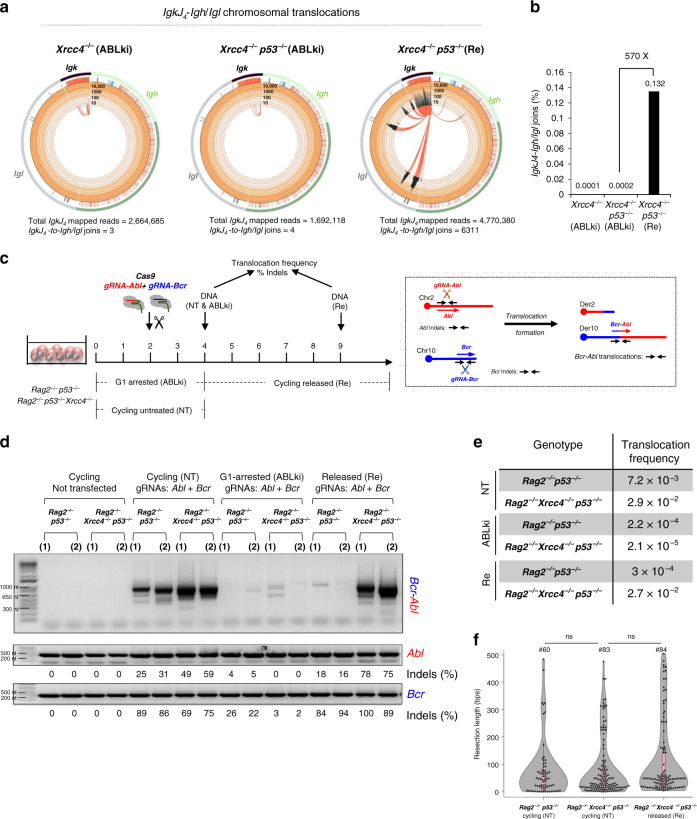
Fig. 3. Unrepaired RAG- and Cas9-induced G1 DSBs promote translocations in S-G2-M.
a Circos plots displaying IgkJ4-Iglregion/Ighregion translocations distribution from IgkJ4 coding end bait libraries. Junctions are represented as arcs originating from IgkJ4 breaks with a minimum of 5 reads per 1,000 bp bin for Xrcc4−/− G1 arrested libraries, 4 reads per 1000 bp bin for Xrcc4−/− p53 −/− G1 arrested libraries and 10 reads per 1000 bp bin for Xrcc4−/− p53 −/− released libraries. Released cells were harvested 4 to 6 days after washing off ABLki. b Quantification of IgkJ4-Iglregion/Ighregion translocations in Xrcc4−/− and Xrcc4−/− p53 −/− v-Abl pro-B cells. Values are the percentages of translocations relative to total mapped reads. Fold enrichment in Xrcc4−/− p53 −/− released cells (Re) as compared to G1 blocked cells (ABLki) is indicated. Graph bars represent the pool of n = 4 independent experiments for Xrcc4−/− G1 blocked cells, n = 3 for Xrcc4−/− p53 −/− G1 blocked cells and n = 6 for Xrcc4−/− p53 −/− released cells with two independent cell lines for each genotype. See also Supplementary Table 4. c Left panel: schematic of DSB induction by Cas9 nuclease in cycling (NT) and G1-arrested (ABLki) v-Abl pro-B cells. Kinetics of ABLki treatment and release (Re) are indicated. Right panel: schematic of the PCR strategy used to amplify Abl and Bcr breakpoint junctions and Bcr-Abl chromosomal translocations. d Representative PCR amplifications of Bcr-Abl translocation breakpoints; in cycling (NT) (transfected or not with Cas9 and gRNAs), G1-arrested (ABLki) and released/cycling (Re) v-Abl pro-B cells of the indicated genotype. PCR of Abl and Bcr loci were used as controls and sequenced to evaluate InDels (from Supplementary Fig. 10D,E). Two independent cell lines were used for each genotype: Rag2−/− p53−/− (17585 & 17587); Rag2−/− Xrcc4−/− p53−/− (Xr-17585-17 & Xr-17585-18). The number of independent experiments is indicated in Supplementary Fig. 13C. Source data are provided as a Source Data file. e Translocation frequency of Bcr-Abl formation for the different genotypes in cycling (NT), G1-arrested (ABLki) and released (Re) conditions (from Supplementary Fig. 10B). f Violin plot representing resection lengths from Bcr and Abl breakpoint sites obtained from Bcr-Abl translocation junction sequences. Each dot indicates the resection length of a unique sequence obtained after TOPO cloning and sequencing with the total number (#) of sequences analyzed indicated (from Supplementary Table 5). No significance (ns) with P > 0.05 by Two-sided Student’s t-test. Rag2−/− p53−/− cycling vs Rag2−/− Xrcc4−/− p53−/− cycling: P = 0.702; Rag2−/− Xrcc4−/− p53−/− cycling vs Rag2−/− Xrcc4−/− p53−/− released: P = 0.085.

