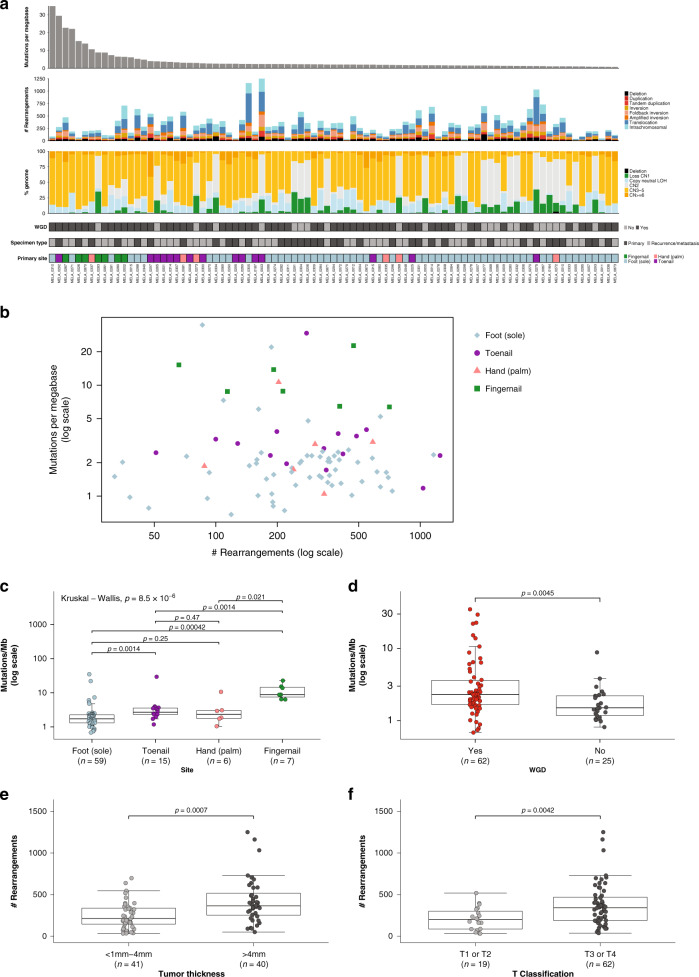
Fig. 1. Somatic variant burden.
a From top to bottom: mutations per megabase (where mutations includes single nucleotide (SNV), dinucleotide (DNV) and trinucleotide variants (TNV) and indels (small insertions and deletions); number and type of structural rearrangement variants; percent of the genome affected by copy number aberrations; whether a tumor has undergone whole genome doubling (WGD); specimen type (primary or recurrence/metastasis); site of primary tumor. b Scatterplot of mutations per megabase (log scale) versus structural rearrangement count (log scale) with points colored by site. c Box plot and overlaid scatterplot of mutation burden (SNV,DNV,TNV, small indel) across different primary sites. Kruskal–Wallis test was used to determine overall significance between signatures and pairwise Mann–Whitney U-tests to compare each pair of sites. The pairwise test p-values displayed are adjusted p-values after correction for multiple testing by FDR. d Box plot of number of mutations per megabase with or without whole genome doubling (Mann–Whitney U-test). e Box plot of number of rearrangements in samples with primary tumor thickness of >4 mm or <1–4 mm (Mann–Whitney U-test). f Box plot of number of rearrangements in samples with primary T Classification of T1 or T2 compared with T3 or T4 (Mann–Whitney U-test). In each box plot, the box boundaries show the first to third quartiles, the median is the center line and the whiskers represent 1.5 times the inter-quartile range.

