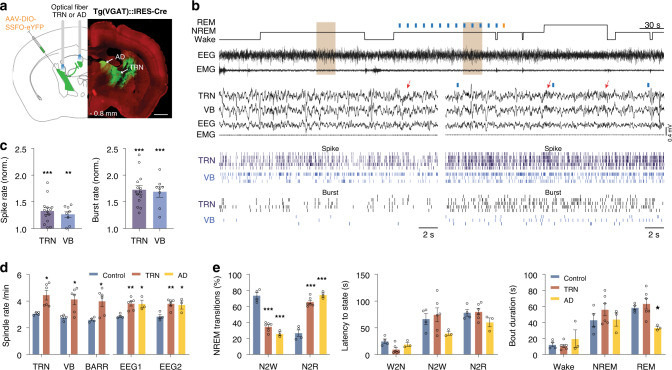
Fig. 5. Optogenetic activation of TRNVGAT cells or TRN-AD terminals increases spindle rate and probability of transitions to REM sleep.
a Schematic representation of stereotactic injection of a EF1α-DIO-SSFO-EYFP adeno-associated virus in the anterior TRN of VGAT::IRES-Cre driver mice, and bilateral optic fiber placement in TRN or AD. b Representative EEG/EMG and thalamic LFP/unit/burst activities during NREM sleep episodes outside and within stimulation of TRNVGAT cells. The brown-shaded areas in the top traces are expanded below. Red arrows indicate the detected spindles. c Quantification of single-unit and burst firing of TRN (n = 14 cells) and VB (n = 8 cells) neurons during TRN activation, normalized to the baseline condition. Both single-unit and burst firing of TRN and VB neurons significantly increased as compared to baseline (TRN stimulation vs. control: TRN: unit: P = 0.0002; t = 5.1; d.f. = 13; burst: P < 0.0001; t = 8.8; d.f. = 13; n = 14 cells, 6 animals; VB: unit: P = 0.003; t = 4.4; d.f. = 7; burst: P = 0.0002; t = 7.0; d.f. = 7; n = 8 cells, 6 animals; two-sided paired t-test; **P < 0.01, ***P < 0.001). d Spindle rate significantly increases upon optogenetic activation of TRNVGAT neurons or their terminals within AD (TRN stimulation vs. control: TRN: P = 0.032, VB: P = 0.035, BARR: P = 0.041, EEG1: P = 0.004, EEG2: P = 0.009; AD stimulation vs. control: EEG1: P = 0.013, EEG2: P = 0.016; F = 4.48; d.f. = 4; two-way ANOVA with Tukey’s post-hoc test; *P < 0.05, **P < 0.01; n = control:4, TRN:6, AD:3 animals). e Averaged NREM sleep transitions (left), latency to next states (middle) and bout duration upon SSFO activation of TRN (red), AD (yellow), or control (blue; TRN or AD stimulation vs. control: NREM transitions: P < 0.0001 for N2R and N2W; F = 0.82; d.f. = 2; latency to vigilance state: P > 0.05 for all states; F = 1.7; d.f. = 4; two-way ANOVA with Tukey’s post-hoc test; *P < 0.05, **P < 0.01, ***P < 0.001; n = control: 4, TRN:6, AD:3 animals). All values are reported as mean ± SEM. Source data are provided as a Source Data file.

