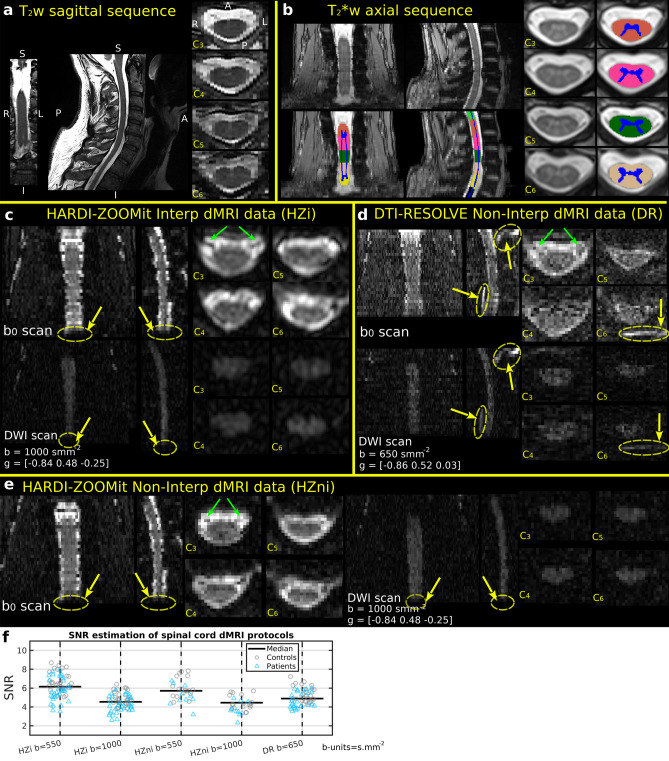
Figure 1.
Raw anatomical MRI data, white and gray matter segmentation, and vertebral level labeling in a single-subject (a–e). Coronal (left), sagittal (middle) and axial (right) images with corresponding cervical (C) vertebral levels are shown; anatomical orientation: S superior, I inferior, R right, L left, A anterior, P posterior, as included in (a); anatomical plane order and direction orientation is the same in all other panels. (a), sagittal sequence (b), axial sequence with WM/GM segmentation and vertebral level labeling overlay (c). Diffusion non-weighted (i.e. scan in the first row of images) and weighted (i.e. DWI scan in the second row of images) images for the HARDI-ZOOMit protocol with Fourier domain interpolation during image reconstruction. Variable b (i.e. b-value) represents a magnitude of applied gradient waveform in the direction of a gradient vector g. Yellow arrows indicate areas of signal loss, green arrows the nerve roots in scan. (d) and DWI scans for the non-interpolated DTI-RESOLVE protocol. Order of and DWI scans and diffusion variable description same as in (c). Yellow arrows indicate locations of ghost artifacts, green arrows the nerve roots in scan. (e) (left) and DWI (right) scans for the non-interpolated HARDI-ZOOMit protocol. Diffusion variable description same as in (c). Yellow arrow indicate areas of signal loss, green arrows the nerve roots in scan. (f) Estimation of signal-to-noise ratio (SNR) in spinal cord DWI scans of investigated protocols.

