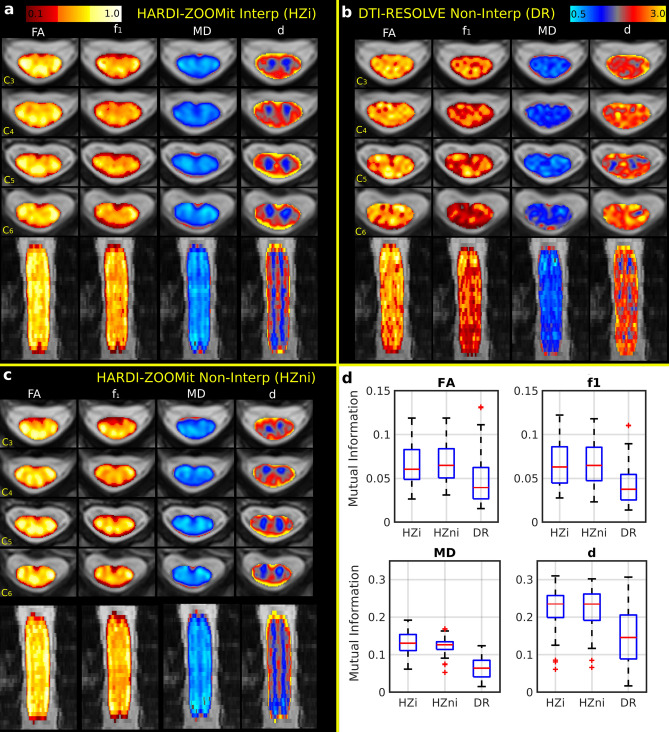
Figure 2.
Diffusion MRI metrics and their correspondence to WM/GM structures in a single-subject (a–c) and across all participants (d). FA (DTI model fractional anisotropy), (Ball and Stick and Stick model partial volume of the 1st principal diffusion direction), MD (DTI model mean diffusivity) and d (Ball and Stick and Stick model intra-voxel mean diffusivity) maps are shown for four representative axial slices and one coronal slice for the HARDI-ZOOMit interpolated protocol (a), the DTI-RESOLVE non-interpolated protocol (b) and the HARDI-ZOOMit non-interpolated protocol (c). All FA and maps use a “hot” colormap (i.e. red–orange–yellow–white colorbar on the top left panel). All MD and d maps are a “blue–yellow” colormap (i.e. lightblue–blue–gray–red–orange–yellow colorbar on the top right panel). All direction orientations of the axial (first four rows of images) or coronal slices (last row of slices) are the same as shown for the sagittal sequence in Fig. 1a. (d) Distributions of mutual information between dMRI metrics and semi-threshold (i.e. background = 0, WM = 2 and GM = 1) WM/GM structure images demonstrate (in comparison to the DTI-RESOLVE protocol) increased mutual entropy level for both HARDI-ZOOMit protocols in all dMRI metrics. Ball and Stick and Stick model diffusivity map (d) has larger mutual entropy with WM/GM structures than DTI model MD map. Both diffusivity maps have larger mutual entropy with WM/GM structures than FA or maps. They still contain some information about WM/GM structures, while mutual information coefficients are > 0.

