

Abstract
We implement a nonlinear rotation-free shell formulation capable of handling large deformations for applications in vascular biomechanics. The formulation employs a previously reported shell element that calculates both the membrane and bending behavior via displacement degrees of freedom for a triangular element. The thickness stretch is statically condensed to enforce vessel wall incompressibility via a plane stress condition. Consequently, the formulation allows incorporation of appropriate 3D constitutive material models. We also incorporate external tissue support conditions to model the effect of surrounding tissue. We present theoretical and variational details of the formulation and verify our implementation against axisymmetric results and literature data. We also adapt a previously reported prestress methodology to identify the unloaded configuration corresponding to the medically imaged in vivo vessel geometry. We verify the prestress methodology in an idealized bifurcation model and demonstrate the significance of including prestress. Lastly, we demonstrate the robustness of our formulation via its application to mouse-specific models of arterial mechanics using an experimentally informed four-fiber constitutive model.
Subject terms: Biomedical engineering, Applied mathematics
Introduction
Computational approaches to simulate cardiovascular mechanics in patient-specific anatomies have attracted significant interest owing to their applications in disease research, medical device design, and surgical planning1–5. To model blood flow in compliant arteries, various fluid-structure interaction (FSI) techniques including Arbitrary Lagrangian-Eulerian and immersed methods have emerged6–8. Modeling both the fluid and solid domain using three-dimensional elements has resulted in high computational costs for complex, patient-specific geometries, posing a significant challenge to achieve results in a clinically relevant time-frame, thus limiting broad adoption in clinical practices. The computational cost of these methods can be greatly reduced by recognizing that most arteries and veins are characterized by a low wall thickness to radius ratio and can therefore be modeled as a thin structure, an assumption supported further by the existence of residual stresses that tend to homogenize the stress distribution across the wall. The Coupled Momentum Method (CMM)9 utilizes this simplification by employing a 2D representation of the vessel wall for modeling blood flow in compliant arteries. Specifically, the CMM employs a linear membrane formulation, resulting in minimal additional computational costs compared to methods with rigid wall approximation. The CMM has been implemented within open-source cardiovascular modeling environments, SimVascular10 and CRIMSON11, and has been utilized in numerous cardiovascular studies12–15. Nevertheless, the CMM is limited due to the use of fixed computational grids and the assumption of geometric and material linearity for the vessel wall behavior. To better capture large deformations and fully nonlinear anisotropic material behaviors, such as in highly compliant regions (e.g., ascending thoracic aorta), the CMM needs to be extended to a fully nonlinear formulation that accounts for both the geometric and material nonlinearities of the vessel wall.
The first essential step towards such a nonlinear FSI framework is development of a robust and computationally efficient nonlinear solid mechanics formulation for the vessel wall. A direct extension of the CMM solid kinematics to a nonlinear membrane model represents the simplest and most computationally efficient option. Yet, a nonlinear membrane model is limited due to the lack of bending stiffness, thereby rendering it inapplicable in regions of high curvature such as branches and bifurcations. Therefore, a nonlinear shell formulation that is capable of handling large deformations, including both membrane and bending modes, is preferred for modeling complex, patient-specific anatomies.
The Kirchhoff-Love theory, which assumes negligible transverse shear deformations, applies to thin pressurized structures characterized by a low thickness to radius ratio. However, given the widespread use of linear elements in solid mechanics, the concomitant necessity of continuity represents a major obstacle in the development of efficient finite element implementations16. Consequently, thick shell formulations based on Reissner-Mindlin theory requiring only continuity have been extensively used (see reference17 for a comprehensive discussion). Such formulations exhibit various locking phenomena (including shear locking), however, and are computationally expensive due to the large number of degrees of freedom necessary to obtain thin wall solutions with reasonable precision18 (e.g., linear triangular shell elements with 54 degrees of freedom per element19). We refer the reader to references20–23 for excellent reviews of shell formulations. Recently, various isogeometric shell models with inherent high continuity in basis functions have been proposed to satisfy the continuity requirement in Kirchhoff-Love theory for thin shells16,24–26. Another promising approach is to express the curvature field in terms of the displacement of nodes of neighboring elements, thereby avoiding the need for rotational degrees of freedom18,27–29. Numerous rotation-free shell elements have been reported, including the basic shell triangle (BST) element27,28, curvature calculation through enhanced geometry (CEG) shell element18, and subdivision surfaces29.
The current work aims to implement a nonlinear structural formulation for realizing our overall vision of developing a strongly coupled, monolithic, computationally efficient, nonlinear FSI framework for vascular biomechanics. The lack of rotational degrees of freedom and the ability to handle non-structured meshes for complex, subject-specific geometries is crucial for such an FSI framework. A rotation-free nonlinear shell formulation for vascular biomechanics will allow vessel wall nonlinearities to be incorporated in biomechanical analyses of complex subject-specific geometries and future extensions to FSI problems via an adaption of the CMM to large displacements.
Another important issue in vascular biomechanics is the lack of knowledge of the stress-free configuration in vivo. Specifically, models constructed from in vivo medical imaging necessarily represent both residually stressed (resulting from vascular development) and pre-stressed (e.g. due to axial preloads and in vivo pressures) vessels. To address this issue, various methods have been proposed either to estimate the state of stress in the in vivo geometry under in vivo loading30–33 or to identify the stress-free configuration directly34–36. One such method is a fixed-point iterative approach introduced by Sellier for general elastostatics problems37 and by Bols et al.38 for cardiovascular biomechanics. This method has been widely used in biomechanical modeling due to its algorithmic simplicity, capability to handle arbitrary material models, and ease of coupling with any finite element package that allows access to nodal displacements39–41.
In this work, we meld two well-known approaches. First, we adapt and expand the rotation-free triangular shell element reported by Oñate and Flores27,28, employing linear triangular shell elements where both the membrane and curvature fields are approximated in terms of the displacement of an element patch comprising the chosen element and three adjacent elements. We perform static condensation of the thickness stretch via incompressibility and a plane stress condition to allow 3D constitutive material models. We also incorporate external tissue support conditions to model the effect of perivascular tethering. Second, we adapt Sellier’s prestress approach for a shell formulation to determine the unloaded traction-free configurations associated with medically-obtained, subject-specific in vivo vessel geometries. Toward this end, we describe the theoretical and implementation details of the proposed shell formulation and verify it against axisymmetric results and literature data. We also verify the prestress methodology in an idealized bifurcation model and demonstrate its significance in predicting arterial wall deformations. Lastly, we demonstrate the utility and robustness of our melded formulation via its application to subject-specific vascular mechanics in the mouse, using a constitutive equation for the wall that has been validated against biaxial mechanical data for murine arteries.
Theoretical formulation
Notation
We use lowercase and uppercase symbols to define quantities in the current and reference (material) configuration, respectively. Symbols with Greek subscripts/superscripts denote in-plane quantities where indices take values while symbols with Latin subscripts/superscripts denote quantities corresponding to 3D and indices take values . We follow Einstein’s index notation where a repeated symbol denotes a summation unless stated otherwise.
Differential geometry of shell
Using the Kirchhoff hypothesis of straight and normal cross-sections, the shell continuum can be described by the midsurface position and the associated normal vector field. Given the position of a point on the midsurface of the shell in the initial configuration, the associated tangent basis vectors are defined as
| 1 |
where and are the surface convective coordinates used to parametrize the shell midsurface. Following Gruttman and Taylor42, an orthonormal basis is defined in the initial configuration as (see Fig. 1)
| 2 |
with associated coordinates indirectly defined as
| 3 |
Figure 1.

Schematic drawing illustrating the basis vectors in the initial and deformed configuration.
Similarly, the basis vectors at a position of a point on the midsurface of the shell in the current configuration can be defined as
| 4 |
Using these definitions and the Kirchhoff hypothesis, positions and of a general point in the initial and current configuration, respectively, of the shell continuum can be described as a function of the midsurface position and associated unit normal vector as
| 5 |
| 6 |
where denotes the perpendicular distance of the point to the midsurface with being the shell thickness in the reference configuration.
The covariant basis vectors at a general point in the initial configuration of the shell continuum are given as and can be expressed in terms of midsurface basis vectors as:
| 7 |
| 8 |
where denotes the partial derivative of a quantity with respect to . The contravariant vectors can be obtained as
| 9 |
Therefore, the metrics can be obtained as
| 10 |
| 11 |
| 12 |
where are the components of the covariant metrics (first fundamental form) in the initial configuration given as
| 13 |
and are the components of the curvature (second fundamental form) of the midsurface in the initial configuration given as
| 14 |
We linearize strain through the thickness and therefore neglect the quadratic term in Eq. (10) to obtain16:
| 15 |
Similarly, using the basis vectors in the current configuration , the metrics in the current configuration are
| 16 |
with
| 17 |
This expression shows that are not components of the unit tensor in the initial configuration for curved surfaces (i.e. where ). Therefore, following Flores and Oñate27, we approximate the covariant components
| 18 |
where denotes the change in curvature of the midsurface and is
| 19 |
Note that the orthonormal basis equation (2) is defined only in the initial configuration and the corresponding basis in the deformed configuration is, in general, not orthonormal (see Fig. 1). Furthermore, the above equations do not reflect changes in thickness during the deformation, which will be considered later.
Shell kinematics
Using the basis vectors defined in Eqs. (7)–(9), the deformation gradient tensor can be written
| 20 |
and the right Cauchy-Green tensor as
| 21 |
Here, the transverse components since . Furthermore, Eq. (21) indicates that the covariant coefficients of the right Cauchy-Green tensor and the metrics in the deformed configuration are identical. However, since , this equation does not reflect the change in shell thickness. Consequently, to account for the thickness deformation, Eq. (21) needs to be replaced by16
| 22 |
with
| 23 |
where will be obtained via plane stress and incompressiblity conditions, as described in “Constitutive models” section. This allows the Jacobian determinant to be expressed as
| 24 |
where denotes the in-plane Jacobian determinant. Equation (24), in combination with the incompressibility condition
| 25 |
yields
| 26 |
This coupling of out-of-plane components with the in-plane metrics ensures satisfaction of the incompressibility constraint.
Next, the Green-Lagrange strain tensor can be written
| 27 |
with
| 28 |
Here, the transverse shear strains vanish since . Furthermore, the transverse normal strain will be statically condensed by employing plane stress and incompressibility constraint, as described in “Constitutive models” section16. Therefore, only the in-plane components remain to be considered and are given as
| 29 |
where denotes the components of the membrane contribution to the Green-Lagrange strain tensor
| 30 |
and denotes the change in curvature of the midsurface given by Eq. (19).
Constitutive models
Next, consider constitutive equations for the shell formulation from a general 3D continuum constitutive model characterized by an elastic strain energy function . To enforce incompressibility, the elastic strain energy function is augmented with a constraint term using a Lagrange multiplier as
| 31 |
For the shell model, the additional unknown can be determined using a plane stress condition16. Following Kiendl et al.16, we first derive the 3D components of the second Piola-Kirchhoff stress tensor () while considering to be a function of as
| 32 |
Correspondingly, the components of the stiffness tensor are
| 33 |
with derivatives of the Jacobian determinant given as
| 34 |
| 35 |
where denote the components of the inverse of the Cauchy-Green tensor. Let the term ‘plane stress’ refer to the state of zero normal transverse stress. Using the plane stress condition
| 36 |
with Eqs. (24), (25), (26), (32), and (34), we obtain
| 37 |
The corresponding derivative is
| 38 |
where denotes the Kronecker delta. Substituting these relations into Eqs. (32) and (33) and using Eqs. (25), (34), and (35), we obtain
| 39 |
| 40 |
These expressions define the 3D stress and elasticity tensor for a general incompressible material under plane stress. To express the in-plane components of these tensors needed for the shell formulation, we perform static condensation of the transverse normal strain so that the entire shell kinematics can be described completely by midsurface quantities. Specifically, the plane stress condition in Eq. (36) is used to eliminate the transverse normal strain as
| 41 |
Therefore, coefficients of the statically condensed stiffness tensor are16
| 42 |
Substituting and in Eqs. (39) and (40) and using Eq. (42), the in-plane components of stress and stiffness tensor needed for the shell formulation are
| 43 |
| 44 |
Using these expressions, a through-thickness integration yields the stress resultants
| 45 |
| 46 |
Equations (43) and (44) provide a consistent method of obtaining in-plane components of stress and stiffness from arbitrary 3D constitutive models. In this work, we consider two different constitutive models:
Mooney-Rivlin
The elastic strain energy for Mooney-Rivlin model is
| 47 |
where , are the material parameters and , are the first and second principal invariants of right Cauchy-Green tensor given as
| 48 |
| 49 |
For the special case of , this model reduces to the incompressible Neo-Hookean model.
Four-fiber family model
The four-fiber family model characterizes arterial wall as a composite structure comprising an elastin-dominated isotropic matrix and four families of embedded collagen fibers. The elastic strain energy is43–45
| 50 |
where , , are material parameters, is again the first invariant of right Cauchy-Green tensor and is the stretch experienced by the k-th fiber family that is oriented along the direction in the reference configuration. The four-fiber families are considered to be aligned along (axial family), (circumferential family) and (symmetric diagonal families), where is a free parameter. The four-fiber family model has recently been recommended as the first choice constitutive model to simulate arterial deformations that lie outside the range of experimental tests46 and has been extensively employed to describe the behavior of both human and murine arterial tissue44,45.
Implementation
The weak form of linear momentum balance can be expressed as
| 51 |
with
| 52 |
| 53 |
| 54 |
where is the mass density, the acceleration, the external force, the virtual displacement, the variation of Green-Lagrange strain tensor, the variation of the curvature, and , are the force and bending stress resultants with their components given by Eqs. (45) and (46).
Interpolation functions
Here, we closely follow Flores and Oñate27. Consider a surface discretization of the shell midsurface using a triangular mesh with linear shape functions associated with displacement degrees of freedom at each node. Since a linear triangular element is flat, the linear shape functions over an element are inadequate for the calculation of curvature. Therefore, following27, to calculate the membrane and bending behavior of a given element (referred as the master element), we employ an element patch comprising the given element and its three neighboring elements (see Fig. 2).
Figure 2.

Schematic of the element patch comprising a master element and three adjacent elements in (A) spatial coordinates and (B) natural coordinates. (C) Plots of the six quadratic shape functions defined over the element patch.
This element patch, comprising six nodes, allows us to consider a quadratic interpolation of the geometry that can be used to compute the membrane and curvature behavior. Figure 2A shows the current configuration of the element patch with the corresponding nodal positions of six nodes given in natural coordinates as (Fig. 2B)
where the nodes of the neighboring elements are ordered such that nodes 4, 5, and 6 refer to those opposite nodes 1, 2, and 3, respectively. The standard linear shape functions defined on a three node triangle are
| 55 |
In addition, we define the following (quadratic) shape functions over the element patch as
where . Figure 2C shows these shape functions over the element patch, which allows us to approximate the position of shell midsurface as
| 56 |
Additionally, we employ a single in-plane quadrature point per element. Similar to the EBST1 element reported by Oñate and Flores28, we employ an assumed strain approach where the gradients at the single quadrature point are approximated via the gradients calculated at the midpoints of the edges of the master element (denoted as , , and in Fig. 2). Referring to Fig. 2, the edges of the master element are numbered such that the edge I refers to the edge opposite to node I (). It can be verified that this choice of shape functions ensures that the gradient at a given edge midpoint depends only on the four nodes surrounding the edge midpoint. Therefore, the gradient at an edge midpoint is unique for the two elements that share this edge since the same four nodes contribute to the gradient at edge midpoint, irrespective of the choice of element over which the gradient is calculated.
Computation of membrane strain
The components of the membrane part of Green-Lagrange strain tensor in Eq. (30) are given in Voigt notation as
| 57 |
Using the assumed strain approach28, we calculate the components of metrics by averaging their values at the edge midpoints as
| 58 |
where the superscript I indicates that the variable has been evaluated at the midpoint of the edge I. While a variety of other choices exist for approximating covariant metrics, the above approach satisfies the patch test and performs well for large deformations47. For the boundary edges (where one or more elements of the patch are missing), the gradient at the edge midpoint is taken to be equal to the gradient calculated over the master element as
| 59 |
where the superscript indicates that the quantity has been calculated using standard three-node linear shape functions defined in Eq. (55). Using Eqs. (4), (17) and (57), the variation of the membrane part of Green-Lagrange strain tensor is obtained as
| 60 |
Further algebraic manipulations needed for implementation are in Supplementary Appendix B online.
Computation of curvature
Following Oñate and Flores28, we assume the curvature to be uniform within each element which can be calculated as the mean over the master element given by
| 61 |
where is the area of the master element in the initial configuration. Integrating by parts and using the divergence theorem,
| 62 |
where denote components of outward normal to the element boundary. Similar to Oñate and Flores28, we consider the standard linear interpolation over the master element for the definition of midsurface normal in the above expression, instead of the quadratic interpolation over the element patch to obtain
| 63 |
This definition yields a uniform value of midsurface normal over the master element, resulting in zero contribution from the second term on the right hand side in Eq. (62). Therefore, the components of the curvature are
| 64 |
Next, consider the line integral as the sum over the integration points (chosen as the edge midpoints) on the edges of the master element
| 65 |
where denotes the length of -th edge in the initial configuration. Equation (65) can be alternatively expressed as
| 66 |
where the gradients are calculated at the edge midpoints using quadratic interpolation. Equation (66) allows the curvatures to be interpreted as projections of vectors over the normal vector. Therefore, if a different direction is chosen (e.g. the midsurface normal obtained via all six nodes of element patch), at an angle to the currently chosen uniform normal, this would have an influence of order in the projection. This justifies the use of a normal defined solely on the master element, Eq. (63), to calculate the curvature.
We defer the treatment of the bending behavior of boundary edges to “Boundary conditions” section. Using Eqs. (19) and (66), the variation of the change in curvature can be expressed as
| 67 |
where the variations of are obtained from Eq. (66) as
| 68 |
For the second term in Eq. (67), the variations of can be expressed as27
| 69 |
where are contravariant basis vectors in the master element defined using the linear interpolation and
| 70 |
| 71 |
Combining Eqs. (68)–(71) with Eq. (67) yields the final expression for the variation of curvature as seen in Supplementary Appendix B online.
Boundary conditions
Treatment of boundary edges (with missing adjacent element) again follows Oñate and Flores28. For the sake of completeness, we mention the key expressions needed for the treatment of boundary conditions and refer the reader to reference28 for more details.
For the membrane terms, gradients at the boundary edges are considered to be equal those in the master element calculated using linear interpolation, see Eq. (59). However, for the curvature terms, and are modified by considering a local-to-edge orthonormal basis comprising the unit normal vector to the plane of symmetry and the unit normal vector along the boundary edge . This results, for a boundary edge defined by node K and J, in the following expressions for and on the boundary edge midpoint:
| 72 |
| 73 |
where the influence of change in the length of vector has been neglected.
External tissue support
Various Robin boundary conditions have been proposed to model effects of the surrounding tissues on the vasculature8,48. These boundary conditions model the mechanical response of the external tissue via a lumped parameter model that relates the stress on the outer wall with its displacement and velocity. Using this approach, we consider an imposed traction on the shell surface given as
| 74 |
where and are the coefficients associated with simplified elastic and the viscoelastic responses of the external tissue, respectively, and represents the extravascular pressure. In general, these parameters can depend both on space and time and can be tuned to match the available data on vessel wall displacement. We assume constant and uniform values, with for all cases.
Time integration
Upon the spatial discretization of the weak form (51), a transient nonlinear system of equations is assembled and then discretized in time and solved using the Generalized- method49 as given in Supplementary Appendix C online.
Prestress methodology
To account for the in vivo state of stress in the medically imaged vessel geometry, we employ an iterative prestress method, first proposed by Sellier37. This method allows an easy interface with any standard finite element solid mechanics package and is applicable for arbitrary choice of material models38,41.
Sellier’s approach employs multiple forward simulations to iteratively update the nodal coordinates to identify the unloaded configuration. For 3D solid mesh elements, the unloaded geometry is described by the nodal coordinates of the mesh. In contrast, for a shell formulation, the unloaded geometry is described by nodal coordinates of shell midsurface and the corresponding thickness distribution over each mesh element. Therefore, the prestress approach for a shell formulation needs to iteratively update both the midsurface coordinates and the thickness distribution to identify the unloaded geometry.
The point of departure is the medically imaged vessel geometry, characterized by midsurface nodal coordinates and elemental thickness . Referring to Fig. 3, the medically imaged in vivo geometry is taken to be the first guess for the unloaded configuration, . Subsequently, the k-th iteration consists of applying the (known) in vivo loading to the k-th initial configuration to compute the k-th deformed configuration . At the end of each iteration, a nodal error vector is calculated as the difference between the coordinates of the deformed configuration and the measured in vivo configuration, . In addition, for a shell formulation, an elemental thickness error vector is calculated as the difference between the thickness distribution of the deformed configuration and the measured in vivo configuration, . The aim of the prestress algorithm is to drive these error vectors to zero by iteratively updating the guess for the unloaded configuration. To this end, the error vectors (with scaling factor, ) are subtracted from the current guess for the unloaded configuration to obtain the unloaded configuration for the next iteration, . This iterative procedure is repeated until the maximum value of the error vectors falls below specified tolerances, i.e., the deformed configuration matches the medically imaged in vivo configuration.
Figure 3.

Algorithm for the prestress methodology to identify an appropriate traction-free reference configuration given available (in vivo) geometries from medical imaging.
In the original approach proposed by Sellier37, the scaling factor, , used to update the reference configuration was taken to be 1. Subsequent reports have revealed that this is not necessarily the best choice and the optimal value of scaling factor might be problem-dependent41. Furthermore, since this approach utilizes a fixed-point iteration method, it can lead to convergence issues for some problems. However, we did not encounter any such issues for the numerical examples reported in this work. We remark that the choice of scaling factor affects only the convergence rate and not the final result. In this work, we have not explored methods to potentially accelerate this rate of convergence and have employed a uniform scaling factor of 0.5.
Results
Verification with axisymmetric solution
First, we compare our numerical results against the well-known axisymmetric solution for a thick-walled cylindrical tube. Details of this solution are provided in Supplementary Appendix A online. This solution provides, in the most general case, the static mechanical response of a thick axisymmetric tube under combined bending, inflation, extension, and torsion50,51. Therefore, the solution of a thin wall tube (which is the object of verification in this study) is a special case of the more general solution.
For purposes of verification, we consider a distension-extension test where the vessel is represented as an incompressible cylindrical tube subjected to axial loading and pressurization. Under these loading conditions, the cylindrical tube deforms largely in the membrane mode, given appropriate boundary conditions at the ends (radial rollers). Consider a cylindrical tube with midsurface radius , axial length, , and wall thickness , resulting in a radius-to-thickness ratio of 20. For this verification, the arterial wall is assumed to be characterized by a four-fiber family model with material parameters listed in Supplementary Table S1 online. The tube is subjected to the loading conditions shown in Fig. 4A: pressurization to 10 mmHg, followed by an extension to an axial stretch of 1.5 at constant pressure and a subsequent pressurization to 80 mmHg. For the pressurization steps, the ends of the vessel are fixed in the axial direction. For the axial extension step, a non-zero displacement is prescribed on the ends to achieve the required axial stretch.
Figure 4.

Verification of shell formulation for a cylindrical tube. (A) Shows the loading conditions, namely pressurization to 10 mmHg, followed by an extension to an axial stretch of 1.5 at constant pressure and, then a subsequent pressurization to 80 mmHg. (B) Shows the final deformed configuration at 80 mmHg. (C–F) Plot the evolution of midsurface radius, first invariant of Green-Lagrange strain tensor, axial stress, and circumferential stress, respectively.
Figure 4B shows the final deformed configuration at 80 mmHg and an axial stretch of 1.5, obtained from the shell formulation. Fig. 4C–F compare the shell formulation results (red) against the axisymmetric theory predictions at axial stretch 1 and 1.5 at the location indicated by the green dotted circle in Fig. 4B. Consider four different metrics: midsurface radius, first invariant of Green-Lagrange strain tensor, and axial and circumferential Cauchy stress. The shell formulation results agree well with the axisymmetric theory for all the metrics considered, verifying our implementation. We remark that, in the absence of an imposed axial stretch (i.e., for axial stretch = 1), the pressurization of cylindrical segments is known to exhibit buckling instabilities52,53. Consequently, the axisymmetric solution for an axial stretch of 1 may not be physically attainable at high pressures. In this work, we only considered a mild pressurization to 10 mmHg for an axial stretch of 1 to avoid this instability and have highlighted the axisymmetric solution for higher inflation pressures via dotted green line to indicate this regime.
Verification against literature data
Next, consider the shell formulation for combined membrane and bending deformation modes. A simply supported circular plate under uniform pressure has been previously used as a benchmark to assess the bending behavior of shell formulations29,54. The plate has a radius and thickness , resulting in a radius-to-thickness ratio of 15. A Mooney-Rivlin material model, as described in “Constitutive models” section, was used with the material parameters and . Figure 5A shows the initial and the deformed configuration of the plate . Figure 5B compares the pressure vs. maximum displacement obtained from our implementation against previously reported results. Specifically, we compare our results against two formulations: (i) subdivision elements reported by Cirak and Ortiz29 and, (ii) selectively-integrated 9 node axisymmetric solid elements reported by Hughes and Carnoy54. Our results agree well with these prior results, thereby demonstrating the ability of the current shell formulation to handle combined bending and membrane deformation modes with excellent accuracy.
Figure 5.
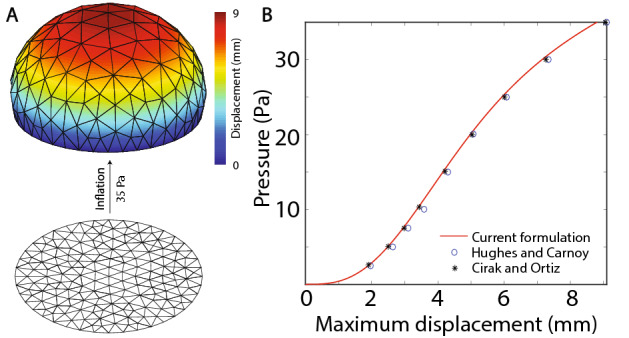
Verification of the current implementation against literature data. (A) Shows the initial and the deformed configuration of a simply supported circular plate inflated under uniform pressure. (B) Compares the pressure vs. maximum displacement obtained from our implementation against literature data.
Prestress verification
Next, we verified our prestress methodology and evaluated the effect of inclusion of prestress in the analysis. Consider an idealized bifurcation model comprising a main artery and a side branch. The main vessel is a cylinder with radius while the side branch is a cylinder with radius . The two branches meet at a right angle with a fillet radius of at the blending region. The wall thickness is taken to be 10% of the local radius, resulting in wall thickness of and for the main vessel and the branch, respectively and a smooth variation of thickness in the blend region. We refer to this analytical configuration as the true unloaded configuration. Without a loss of generality, we assumed a Neo-Hookean material model with . We employ radially-free boundary conditions for the ends such that nodes are free to move in the radial direction while fixed in the longitudinal direction, to enforce fixed axial extensions, and constrained circumferentially, to ensure axisymmetry.
To create the reference dataset for the verification of prestress algorithm, we first perform a standard forward analysis where we subject the true unloaded configuration to and to obtain true diastolic and true systolic configurations, respectively. Next, we pretend that the true diastolic configuration is obtained from medical imaging but the corresponding unloaded configuration is unknown. Hence, starting from the true diastolic configuration, the corresponding systolic configuration can be obtained via two possible analyses:
With prestress: Here, the true diastolic configuration is subjected to a prestress analysis to first obtain the corresponding unloaded configuration. Subsequently, this unloaded configuration is subjected to systolic pressure () to obtain the systolic configuration.
Without prestress: Here, the true diastolic configuration is assumed to be the unloaded configuration and is directly subjected to systolic pressure () to obtain the systolic configuration. This case mimics the frequently employed approach where subject-specific anatomies are simulated neglecting prestress30,55,56.
Therefore, the analysis with prestress includes an intermediate step of identifying the unloaded configuration via the aforementioned prestress algorithm. Figure 6A–C show different configurations obtained via these analyses. Specifically, Fig. 6A shows the true unloaded, diastolic, and systolic configurations obtained via a standard forward analysis. Figure 6B,C show the corresponding configurations obtained from the analysis with and without prestress, respectively. Figure 6D shows the enlarged versions of these configurations along the planes I, II, and III indicated in Fig. 6A–C, respectively. Referring to the left and the middle column of Fig. 6D, we note that the predicted unloaded configuration with prestress is almost identical to the true unloaded configuration. Furthermore, the predicted systolic configuration with the inclusion of prestress agreed well with the true systolic configuration. In contrast, the predicted systolic configuration without the inclusion of prestress (right column of Fig. 6D) is much larger than the true systolic configuration (left column of Fig. 6D). Next, Fig. 6E–G show circumferential variations of different metrics in the predicted systolic configurations at an arbitrarily chosen location on the side branch, indicated by the dotted green lines in Fig. 6A–C. Specifically, we compare three different metrics in the predicted systolic configuration: wall thickness, first invariant of the Green-Lagrange strain tensor, and circumferential Cauchy stress. Again, results obtained with the inclusion of prestress are in excellent agreement with the true results while the results without the inclusion of prestress differ significantly from the true results for all the metrics.
Figure 6.

Prestress verification against forward solution. (A–C) show the different configurations pertaining to the true solution, solution with prestress, and solution without prestress, respectively. (D) shows the enlarged versions of these configurations along the planes I, II, and III indicated in (A–C). (E–G) show the comparison of circumferential variation of different metrics among true solution, solution with prestress, and solution without prestress at the side branch location indicated by dotted green line in (A–C).
Application to subject-specific geometries
Next, we demonstrate the utility of our shell formulation and prestress algorithm for mouse-specific anatomies featuring multiple branches. These anatomies were obtained via non-invasive in vivo micro-CT and have been used in our previous work12. We employ an independently validated four-fiber family constitutive model to describe the behavior of the aortic wall. The regionally varying material parameters and distributions of wall thickness were obtained through in vitro biaxial tests (Supplementary Table S2 online). Further details about the experimental procedures can be found elsewhere12. We employ radially-free boundary conditions for the aortic wall ends, as described in “Prestress verification” section. In order to avoid unphysiological deformations and buckling of the arterial wall, it is crucial to include external tissue support boundary conditions to model the effect of surrounding tissue. Therefore, we incorporate the external tissue support conditions described in Eq. (74) with .
Figure 7A shows the volume rendered geometric model and the associated skeleton, obtained from the micro-CT data for a 20-week old wild-type mouse. Starting from this anatomy and the experimentally obtained wall properties (material parameters and thickness distribution), we employ our prestress algorithm to identify the corresponding unloaded geometry, which was not available in this anesthetized mouse. Figure 7B shows the predicted unloaded configuration overlaid on the medically imaged in vivo anatomy. Figure 7C shows enlarged views of the three different locations (I, II, III) indicated in Fig. 7B. It can be seen that the predicted unloaded configuration is contained within the in vivo configuration at all three locations. These results support the ability of our prestress algorihtm to handle complex, subject-specific anatomies with multiple branches.
Figure 7.

(A) Volume rendered geometric model of the aortic anatomy of a 20 weeks old wild type female mice. (B) Plots of the predicted unloaded configuration overlaid upon the medically imaged in vivo anatomy. (C) Enlarged version of unloaded and in vivo configurations at three different locations indicated in (B). (D) Volume rendered geometric model of the aortic anatomy of a knockout male mice. (E) Plots of the predicted unloaded configuration overlaid upon the medically imaged in vivo anatomy. (F) Enlarged version of unloaded and in vivo configurations at three different locations indicated in (E).
To further test the robustness of our implementation, we repeat the same analysis on a knockout (KO) mouse. The regionally varying material parameters for the four-fiber constitutive model and the thickness distribution are listed in Supplementary Table S3 online. Figure 7D shows the corresponding volume rendered geometric model of the aortic anatomy and associated skeleton obtained from the micro-CT data. The KO anatomy exhibits a marked increase in tortuosity and therefore serves as a more stringent test to assess our implementation for complex, subject-specific anatomies. Figure 7E shows the predicted unloaded configuration overlaid on the medically imaged in vivo anatomy while Fig. 7F shows the corresponding enlarged version at three different locations indicated in Fig. 7E. As expected, the predicted unloaded configuration is smaller than the in vivo configuration. Note that the deformation of the aortic wall in the regions of vessel bifurcations is characterized by significant bending.
Figure 8 shows deformations of the arterial wall of a wild-type mouse without (panel A) or with (panel B) external tissue support. The solution without external tissue support exhibits unphysiological large deformations, leading to buckling in the head branches and eventual failure of the prestress analysis at . In contrast, the analysis with external tissue support exhibits no buckling and yields realistic deformations of arterial wall at .
Figure 8.

(A) Analysis without incorporation of external tissue support. The solution is characterized by unphysiological large deformations of the arterial wall leading to buckling in head branches and eventual failure of the simulation at . (B) Analysis with the incorporation of external tissue support. The systolic configuration at is characterized by a physiological range of arterial wall deformations.
Therefore, these results serve as a confirmation of the ability of our shell formulation to handle combined membrane and bending mode deformations in complex image-based multi-branched vascular models.
Discussion and conclusions
We have implemented a geometrically and materially nonlinear rotation-free shell formulation capable of handling large deformations for vascular biomechanical applications. The formulation accounts for both membrane and bending behaviors with only displacement degrees of freedom by considering an element patch comprising the chosen element and the three adjacent elements. We performed static condensation of the thickness stretch using incompressibility and a plane stress condition; this provides a consistent method for incorporating arbitrary 3D constitutive models in our formulation. We also adapted a previously reported prestress algorithm to this shell formulation. Lastly, we incorporated the effect of surrounding tissue on vasculature by including external tissue support boundary conditions.
We verified the membrane behavior of the shell formulation by considering a distension–extension test on a cylindrical geometry and comparing our results against benchmark predictions. We further verified our shell formulation for combined membrane and bending modes by considering the deformation of a simply supported circular plate under uniform pressure, again with excellent agreement with prior findings by others.
Furthermore, we verified the prestress algorithm against standard forward calculations in an idealized bifurcation model. Our results indicate that given the in vivo pressure, anatomy, and associated mechanical properties (constitutive model, material parameters, and wall thickness), the prestress algorithm is able to accurately predict the unloaded configuration. This is an important demonstration given that both residual stresses (those existing in the traction-free configuration) and prestresses (those existing in vivo at diastolic pressure) are well known to influence significantly the calculated values of wall stress50, yet they are difficult to estimate directly via either experimental (e.g., opening angle tests and retraction measurements upon transection) or theoretical (e.g., growth and remodeling simulations, noting that residual and prestresses arise in part during vascular development) methods. Our results confirm that an analysis without prestress significantly overestimates the deformations of the arterial wall, thereby highlighting the need to include prestress in the analysis.
Lastly, we demonstrated the utility and robustness of our implementation by melding the shell formulation and prestress algorithm to identify the unloaded configuration of mouse-specific anatomies for wild-type and KO mice studied under anesthesia. These anatomies include multiple branches and exhibit significant bending around vessel bifurcations. Therefore, these cases serve as a test of the ability of our shell formulation to handle vascular deformations under complex membrane and bending modes. For these examples, we used an experimentally informed four-fiber constitutive material model to capture known nonlinearities and anisotropies, which vary by region. Our prestress algorithm predicted reasonable unloaded configurations for both anatomies, confirming the robustness of our implementation for application to complex, subject-specific anatomies.
The lack of rotational degrees of freedom in the presented nonlinear shell formulation makes it well-suited to serve as the structural model for a strongly coupled, monolithic, computationally efficient, nonlinear fluid-structure interaction framework via an adaption of the CMM to large displacements. Although prior simulations, including our own12,13, have proven useful in studying fluid–solid interactions in many regions of the vasculature, the present formulation promises to be better suited to study ventricular-vascular interactions, particularly since the ascending aorta experiences dramatic finite distension, extension, and bending during the cardiac cycle. The presented shell formulation is also suitable for including growth and remodeling by using a constrained mixture theory (CMT)57. Including CMT in future fluid-solid simulations will extend our prior work58 to subject-specific geometries and large displacements and thereby improve the understanding of the interplay between altered hemodynamics and vascular adaptation. Since the current shell formulation is based only on displacement degrees of freedom, it also enables standard integration with the methodologies proposed in literature to perform acute stress analysis on stents59, to investigate vascular adaptation following the stent implantation60, and indeed to consider a host of clinical interventions for patient-specific geometries.
Supplementary information
Acknowledgements
This work was supported, in part, by grants from National Institute of Health (R01 HL105297), American Heart Association postdoctoral fellowship (AHA 20POST35220004), and by the Edward B. Diethrich M.D. Professorship.
Author contributions
N.N. developed and implemented the theoretical formulation, performed computational analysis and drafted the manuscript; M.A. contributed to the development of theoretical formulation and its implementation and drafted the manuscript; J.D.H. jointly conceived and coordinated the study, provided all experimental data on the mice, and revised the final draft; C.A.F. jointly conceived and coordinated the study, provided overall supervision and drafted the manuscript. All authors approved the final manuscript.
Data availability
All data generated or analysed during this study are included in this published article (and its Supplementary Information files).
Competing interests
The authors declare no competing interests.
Footnotes
Publisher's note
Springer Nature remains neutral with regard to jurisdictional claims in published maps and institutional affiliations.
Supplementary information
is available for this paper at 10.1038/s41598-020-74277-5.
References
- 1.Tossas-Betancourt C, van Bakel TM, Arthurs CJ, Coleman DM, Eliason JL, Figueroa CA, Stanley JC. Computational analysis of renal artery flow characteristics by modeling aortoplasty and aortic bypass interventions for abdominal aortic coarctation. J. Vasc. Surg. 2020;71:505–516. doi: 10.1016/j.jvs.2019.02.063. [DOI] [PMC free article] [PubMed] [Google Scholar]
- 2.van Bakel TM, Arthurs CJ, Van Herwaarden JA, Moll FL, Eagle KA, Patel HJ, Trimarchi S, Figueroa CA. A computational analysis of different endograft designs for zone 0 aortic arch repair. Eur. J. Cardio-Thorac. Surg. 2018;54:389–396. doi: 10.1093/ejcts/ezy068. [DOI] [PubMed] [Google Scholar]
- 3.van Bakel TM, Burris NS, Patel HJ, Figueroa CA. Ascending aortic rupture after zone 2 endovascular repair: A multiparametric computational analysis. Eur. J. Cardio-Thorac. Surg. 2019;56:618–621. doi: 10.1093/ejcts/ezy458. [DOI] [PMC free article] [PubMed] [Google Scholar]
- 4.Holzapfel, G. A. Computational biomechanics of soft biological tissue. Encyclopedia of computational mechanics (2004).
- 5.Doyle BJ, Norman PE. Computational biomechanics in thoracic aortic dissection: Today’s approaches and tomorrow’s opportunities. Ann. Biomed. Eng. 2016;44:71–83. doi: 10.1007/s10439-015-1366-8. [DOI] [PubMed] [Google Scholar]
- 6.Bäumler, K., Vedula, V., Sailer, A. M., Seo, J., Chiu, P., Mistelbauer, G., Chan, F. P., Fischbein, M. P., Marsden, A. L. & Fleischmann, D. Fluid-structure interaction simulations of patient-specific aortic dissection. In Biomechanics and Modeling in Mechanobiology 1–22 (2020). [DOI] [PubMed]
- 7.Takizawa K, Bazilevs Y, Tezduyar TE. Space-time and ALE-VMS techniques for patient-specific cardiovascular fluid–structure interaction modeling. Arch. Comput. Methods Eng. 2012;19:171–225. doi: 10.1007/s11831-012-9071-3. [DOI] [Google Scholar]
- 8.Reymond P, Crosetto P, Deparis S, Quarteroni A, Stergiopulos N. Physiological simulation of blood flow in the aorta: Comparison of hemodynamic indices as predicted by 3-D FSI, 3-D rigid wall and 1-D models. Med. Eng. Phys. 2013;35:784–791. doi: 10.1016/j.medengphy.2012.08.009. [DOI] [PubMed] [Google Scholar]
- 9.Figueroa CA, Vignon-Clementel IE, Jansen KE, Hughes TJ, Taylor CA. A coupled momentum method for modeling blood flow in three-dimensional deformable arteries. Comput. Methods Appl. Mech. Eng. 2006;195:5685–5706. doi: 10.1016/j.cma.2005.11.011. [DOI] [Google Scholar]
- 10.Updegrove A, Wilson NM, Merkow J, Lan H, Marsden AL, Shadden SC. Simvascular: An open source pipeline for cardiovascular simulation. Ann. Biomed. Eng. 2017;45:525–541. doi: 10.1007/s10439-016-1762-8. [DOI] [PMC free article] [PubMed] [Google Scholar]
- 11.CRIMSON software. http://www.crimson.software/. Accessed 20 Apr 2020.
- 12.Cuomo F, Ferruzzi J, Agarwal P, Li C, Zhuang ZW, Humphrey JD, Figueroa CA. Sex-dependent differences in central artery haemodynamics in normal and fibulin-5 deficient mice: Implications for ageing. Proc. R. Soc. A. 2019;475:20180076. doi: 10.1098/rspa.2018.0076. [DOI] [PMC free article] [PubMed] [Google Scholar]
- 13.Cuomo F, Roccabianca S, Dillon-Murphy D, Xiao N, Humphrey JD, Figueroa CA. Effects of age-associated regional changes in aortic stiffness on human hemodynamics revealed by computational modeling. PLoS ONE. 2017;12:e0173177. doi: 10.1371/journal.pone.0173177. [DOI] [PMC free article] [PubMed] [Google Scholar]
- 14.Xiao N, Alastruey J, Figueroa CA. A systematic comparison between 1-D and 3-D hemodynamics in compliant arterial models. Int. J. Numer. Methods Biomed. Eng. 2014;30:204–231. doi: 10.1002/cnm.2598. [DOI] [PMC free article] [PubMed] [Google Scholar]
- 15.Xiao N, Humphrey JD, Figueroa CA. Multi-scale computational model of three-dimensional hemodynamics within a deformable full-body arterial network. J. Comput. Phys. 2013;244:22–40. doi: 10.1016/j.jcp.2012.09.016. [DOI] [PMC free article] [PubMed] [Google Scholar]
- 16.Kiendl J, Hsu M-C, Wu MC, Reali A. Isogeometric Kirchhoff-love shell formulations for general hyperelastic materials. Comput. Methods Appl. Mech. Eng. 2015;291:280–303. doi: 10.1016/j.cma.2015.03.010. [DOI] [Google Scholar]
- 17.Bischoff, M., Ramm, E. & Irslinger, J. Models and finite elements for thin-walled structures. Encycl. Comput. Mech. Second Ed. 1–86 (2018).
- 18.Linhard J, Wüchner R, Bletzinger K-U. “Upgrading” membranes to shells-the CEG rotation free shell element and its application in structural analysis. Finite Elem. Anal. Des. 2007;44:63–74. doi: 10.1016/j.finel.2007.09.001. [DOI] [Google Scholar]
- 19.Basar Y, Ding Y. Finite-element analysis of hyperelastic thin shells with large strains. Comput. Mech. 1996;18:200–214. doi: 10.1007/BF00369938. [DOI] [Google Scholar]
- 20.Ashwell DG, Gallagher RH. Finite Elements for Thin Shells and Curved Members. New York: Wiley; 1976. [Google Scholar]
- 21.Chapelle D, Bathe K-J. Fundamental considerations for the finite element analysis of shell structures. Comput. Struct. 1998;66:19–36. doi: 10.1016/S0045-7949(97)00078-3. [DOI] [Google Scholar]
- 22.MacNeal RH. Perspective on finite elements for shell analysis. Finite Elem. Anal. Des. 1998;30:175–186. doi: 10.1016/S0168-874X(98)00005-5. [DOI] [Google Scholar]
- 23.Bucalem M, Bathe K-J. Finite element analysis of shell structures. Arch. Comput. Methods Eng. 1997;4:3–61. doi: 10.1007/BF02818930. [DOI] [Google Scholar]
- 24.Kiendl J, Bletzinger K-U, Linhard J, Wüchner R. Isogeometric shell analysis with Kirchhoff-love elements. Comput. Methods Appl. Mech. Eng. 2009;198:3902–3914. doi: 10.1016/j.cma.2009.08.013. [DOI] [Google Scholar]
- 25.Tepole AB, Kabaria H, Bletzinger K-U, Kuhl E. Isogeometric Kirchhoff-love shell formulations for biological membranes. Comput. Methods Appl. Mech. Eng. 2015;293:328–347. doi: 10.1016/j.cma.2015.05.006. [DOI] [PMC free article] [PubMed] [Google Scholar]
- 26.Ambati M, Kiendl J, De Lorenzis L. Isogeometric Kirchhoff-love shell formulation for elasto-plasticity. Comput. Methods Appl. Mech. Eng. 2018;340:320–339. doi: 10.1016/j.cma.2018.05.023. [DOI] [Google Scholar]
- 27.Flores FG, Oñate E. Improvements in the membrane behaviour of the three node rotation-free BST shell triangle using an assumed strain approach. Comput. Methods Appl. Mech. Eng. 2005;194:907–932. doi: 10.1016/j.cma.2003.08.012. [DOI] [Google Scholar]
- 28.Oñate E, Flores FG. Advances in the formulation of the rotation-free basic shell triangle. Comput. Methods Appl. Mech. Eng. 2005;194:2406–2443. doi: 10.1016/j.cma.2004.07.039. [DOI] [Google Scholar]
- 29.Cirak F, Ortiz M. Fully C1-conforming subdivision elements for finite deformation thin-shell analysis. Int. J. Numer. Methods Eng. 2001;51:813–833. doi: 10.1002/nme.182.abs. [DOI] [Google Scholar]
- 30.Gee MW, Förster C, Wall W. A computational strategy for prestressing patient-specific biomechanical problems under finite deformation. Int. J. Numer. Methods Biomed. Eng. 2010;26:52–72. doi: 10.1002/cnm.1236. [DOI] [Google Scholar]
- 31.Grytz R, Downs JC. A forward incremental prestressing method with application to inverse parameter estimations and eye-specific simulations of posterior scleral shells. Comput. Methods Biomech. Biomed. Eng. 2013;16:768–780. doi: 10.1080/10255842.2011.641119. [DOI] [PMC free article] [PubMed] [Google Scholar]
- 32.de Putter S, Wolters BJBM, Rutten MCM, Breeuwer M, Gerritsen FA, van de Vosse FN. Patient-specific initial wall stress in abdominal aortic aneurysms with a backward incremental method. J. Biomech. 2007;40:1081–1090. doi: 10.1016/j.jbiomech.2006.04.019. [DOI] [PubMed] [Google Scholar]
- 33.Weisbecker H, Pierce DM, Holzapfel GA. A generalized prestressing algorithm for finite element simulations of preloaded geometries with application to the aorta. Int. J. Numer. Methods Biomed. Eng. 2014;30:857–872. doi: 10.1002/cnm.2632. [DOI] [PubMed] [Google Scholar]
- 34.Govindjee S, Mihalic PA. Computational methods for inverse deformations in quasi-incompressible finite elasticity. Int. J. Numer. Methods Eng. 1998;43:821–838. doi: 10.1002/(SICI)1097-0207(19981115)43:5<821::AID-NME453>3.0.CO;2-C. [DOI] [Google Scholar]
- 35.Govindjee S, Mihalic PA. Computational methods for inverse finite elastostatics. Comput. Methods Appl. Mech. Eng. 1996;136:47–57. doi: 10.1016/0045-7825(96)01045-6. [DOI] [Google Scholar]
- 36.Lu J, Zhou X, Raghavan ML. Inverse elastostatic stress analysis in pre-deformed biological structures: Demonstration using abdominal aortic aneurysms. J. Biomech. 2007;40:693–696. doi: 10.1016/j.jbiomech.2006.01.015. [DOI] [PubMed] [Google Scholar]
- 37.Sellier M. An iterative method for the inverse elasto-static problem. J. Fluids Struct. 2011;27:1461–1470. doi: 10.1016/j.jfluidstructs.2011.08.002. [DOI] [Google Scholar]
- 38.Bols J, Degroote J, Trachet B, Verhegghe B, Segers P, Vierendeels J. A computational method to assess the in vivo stresses and unloaded configuration of patient-specific blood vessels. J. Comput. Appl. Math. 2013;246:10–17. doi: 10.1016/j.cam.2012.10.034. [DOI] [Google Scholar]
- 39.Wittek A, Karatolios K, Bihari P, Schmitz-Rixen T, Moosdorf R, Vogt S, Blase C. In vivo determination of elastic properties of the human aorta based on 4D ultrasound data. J. Mech. Behav. Biomed. Mater. 2013;27:167–183. doi: 10.1016/j.jmbbm.2013.03.014. [DOI] [PubMed] [Google Scholar]
- 40.Wang H, Gao H, Luo XY, Berry C, Griffith BE, Ogden RW, Wang TJ. Structure-based finite strain modelling of the human left ventricle in diastole. Int. J. Numer. Methods Biomed. Eng. 2013;29:83–103. doi: 10.1002/cnm.2497. [DOI] [PubMed] [Google Scholar]
- 41.Rausch MK, Genet M, Humphrey JD. An augmented iterative method for identifying a stress-free reference configuration in image-based biomechanical modeling. J. Biomech. 2017;58:227–231. doi: 10.1016/j.jbiomech.2017.04.021. [DOI] [PMC free article] [PubMed] [Google Scholar]
- 42.Gruttmann F, Taylor R. Theory and finite element formulation of rubberlike membrane shells using principal stretches. Int. J. Numer. Methods Eng. 1992;35:1111–1126. doi: 10.1002/nme.1620350511. [DOI] [Google Scholar]
- 43.Eberth J, Cardamone L, Humphrey JD. Evolving biaxial mechanical properties of mouse carotid arteries in hypertension. J. Biomech. 2011;44:2532–2537. doi: 10.1016/j.jbiomech.2011.07.018. [DOI] [PMC free article] [PubMed] [Google Scholar]
- 44.Roccabianca S, Figueroa CA, Tellides G, Humphrey JD. Quantification of regional differences in aortic stiffness in the aging human. J. Mech. Behav. Biomed. Mater. 2014;29:618–634. doi: 10.1016/j.jmbbm.2013.01.026. [DOI] [PMC free article] [PubMed] [Google Scholar]
- 45.Ferruzzi J, Collins MJ, Yeh AT, Humphrey JD. Mechanical assessment of elastin integrity in fibrillin-1-deficient carotid arteries: Implications for Marfan syndrome. Cardiovasc. Res. 2011;92:287–295. doi: 10.1093/cvr/cvr195. [DOI] [PMC free article] [PubMed] [Google Scholar]
- 46.Schroeder F, Polzer S, Slažanskỳ M, Man V, Skácel P. Predictive capabilities of various constitutive models for arterial tissue. J. Mech. Behav. Biomed. Mater. 2018;78:369–380. doi: 10.1016/j.jmbbm.2017.11.035. [DOI] [PubMed] [Google Scholar]
- 47.Flores FG, Oñate E. Wrinkling and folding analysis of elastic membranes using an enhanced rotation-free thin shell triangular element. Finite Elem. Anal. Des. 2011;47:982–990. doi: 10.1016/j.finel.2011.03.014. [DOI] [Google Scholar]
- 48.Moireau P, Xiao N, Astorino M, Figueroa CA, Chapelle D, Taylor CA, Gerbeau JF. External tissue support and fluid-structure simulation in blood flows. Biomech. Model. Mechanobiol. 2012;11:1–18. doi: 10.1007/s10237-011-0289-z. [DOI] [PubMed] [Google Scholar]
- 49.Chung, J. & Hulbert, G. A Time Integration Algorithm for Structural Dynamics with Improved Numerical Dissipation: The Generalized- Method. (1993).
- 50.Humphrey JD. Cardiovascular Solid Mechanics: Cells, Tissues, and Organs. Berlin: Springer; 2013. [Google Scholar]
- 51.Holzapfel GA, Gasser TC, Ogden RW. A new constitutive framework for arterial wall mechanics and a comparative study of material models. J. Elast. Phys. Sci. Solids. 2000;61:1–48. doi: 10.1016/S0022-3697(99)00252-8. [DOI] [Google Scholar]
- 52.Han H-C. A biomechanical model of artery buckling. J. Biomech. 2007;40:3672–3678. doi: 10.1016/j.jbiomech.2007.06.018. [DOI] [PMC free article] [PubMed] [Google Scholar]
- 53.Han H-C, Chesnutt JK, Garcia JR, Liu Q, Wen Q. Artery buckling: New phenotypes, models, and applications. Ann. Biomed. Eng. 2013;41:1399–1410. doi: 10.1007/s10439-012-0707-0. [DOI] [PMC free article] [PubMed] [Google Scholar]
- 54.Hughes TJ, Carnoy E. Nonlinear finite element shell formulation accounting for large membrane strains. Comput. Methods Appl. Mech. Eng. 1983;39:69–82. doi: 10.1016/0045-7825(83)90074-9. [DOI] [Google Scholar]
- 55.Wang DH, Makaroun MS, Webster MW, Vorp DA. Effect of intraluminal thrombus on wall stress in patient-specific models of abdominal aortic aneurysm. J. Vasc. Surg. 2002;36:598–604. doi: 10.1067/mva.2002.126087. [DOI] [PubMed] [Google Scholar]
- 56.Fillinger MF, Marra SP, Raghavan ML, Kennedy FE. Prediction of rupture risk in abdominal aortic aneurysm during observation: Wall stress versus diameter. J. Vasc. Surg. 2003;37:724–732. doi: 10.1067/mva.2003.213. [DOI] [PubMed] [Google Scholar]
- 57.Humphrey J, Rajagopal K. A constrained mixture model for growth and remodeling of soft tissues. Math. Models Methods Appl. Sci. 2002;12:407–430. doi: 10.1142/S0218202502001714. [DOI] [Google Scholar]
- 58.Figueroa CA, Baek S, Taylor CA, Humphrey JD. A computational framework for fluid-solid-growth modeling in cardiovascular simulations. Comput. Methods Appl. Mech. Eng. 2009;198:3583–3602. doi: 10.1016/j.cma.2008.09.013. [DOI] [PMC free article] [PubMed] [Google Scholar]
- 59.Lally C, Dolan F, Prendergast P. Cardiovascular stent design and vessel stresses: A finite element analysis. J. Biomech. 2005;38:1574–1581. doi: 10.1016/j.jbiomech.2004.07.022. [DOI] [PubMed] [Google Scholar]
- 60.Laubrie JD, Mousavi JS, Avril S. A new finite-element shell model for arterial growth and remodeling after stent implantation. Int. J. Numer. Methods Biomed. Eng. 2020;36:e3282. doi: 10.1002/cnm.3282. [DOI] [PubMed] [Google Scholar]
Associated Data
This section collects any data citations, data availability statements, or supplementary materials included in this article.
Supplementary Materials
Data Availability Statement
All data generated or analysed during this study are included in this published article (and its Supplementary Information files).