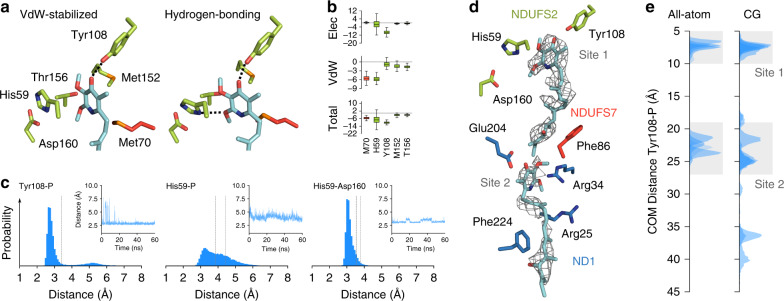
Fig. 3. Molecular dynamics simulations of piericidin in complex I.
a Snapshots from the MD simulations of piericidin in van der Waals (VdW)-stabilised and hydrogen-bonded conformations. Hydrogen bonds are indicated by dotted lines. b Interaction energies between piericidin and selected surrounding residues (total, van der Waals, and electrostatic contributions in kcal mol−1). Green, residues in NDUFS2; red, residues in NDUFS7. The boxes extend from the 25th to the 75th percentile, the middle line represents the median. The whiskers show the range of the data from the 10th to 90th percentile (n = 1500, snapshots calculated every 40 ps). c Distance distributions (simulations A1–A4, Supplementary Table 4) and time traces of distances (simulation A1) between piericidin (P) and key residues. Left: piericidin 4′ carbonyl oxygen to Tyr108 hydroxyl oxygen. Middle: piericidin 2′ methoxy oxygen to His59 (centre of mass of Nδ/Cε/Nε). Right: His59 (centre-of-mass of Nδ/Cε/Nε) to Asp160 (centre-of-mass of carboxylic group). Experimental distances (Fig. 2c) for the refined structure (dark grey) and ring-flipped model (light grey) are shown as dotted lines. See Supplementary Fig. 4 for further time traces from individual simulations, and distances to Thr156. d The two modelled piericidin molecules with the experimental cryo-EM density (PyMol-2.2.3 density level 4.0, carve radius = 1.8) and surrounding residues. e Distance distributions of piericidin in the substrate cavity obtained from classical (left, simulation A1–A5, 220 ns total) and coarse-grained MD simulations (right, simulation C1–C10, 100 µs total). Distances are between the centre of masses of the Tyr108 and piericidin rings.

