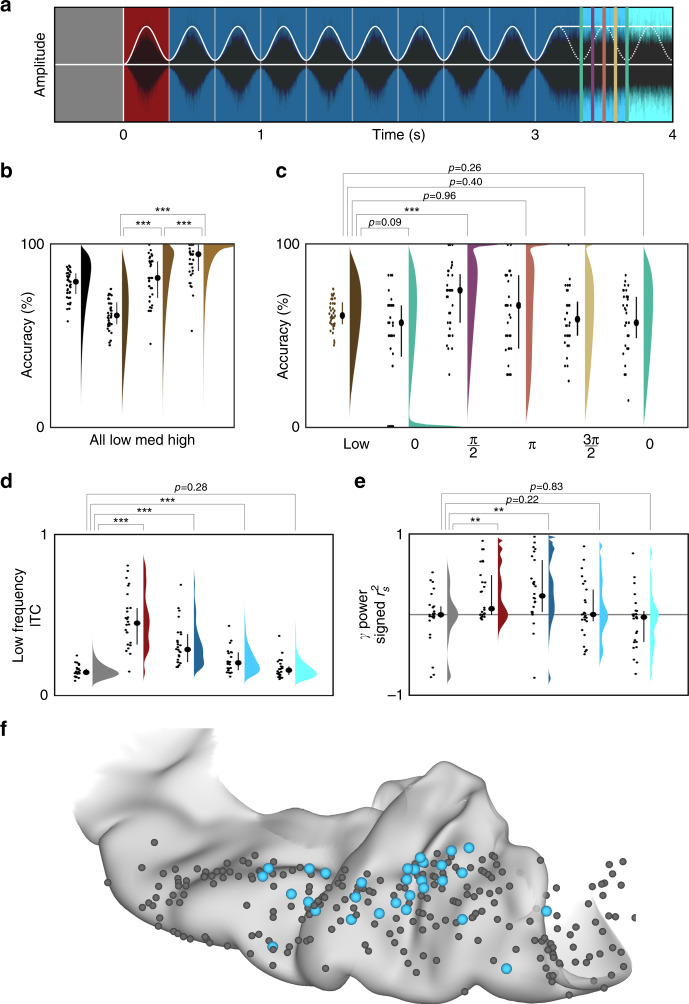
Fig. 4. Prediction of timing in auditory cortex.
Low-frequency phase in early auditory cortex shows evidence of predictive encoding. a The stimulus was divided into five intervals: baseline (gray), onset (red), sustained (dark blue), early prediction (medium blue), and late prediction (light blue). Crucially, there is no modulation of white noise amplitude in either of the prediction intervals. Tones were presented in 50% of trials at one of three intensities and one of five temporal delays. b Performance accuracy at each intensity level, grouped across delay categories. For each condition, the raw data (left), interquartile range (middle), and kernel density estimate (right) are shown. Significance was determined in d, e with the Wilcoxon signed-rank test (*p < 0.05, **p < 0.01, ***p < 0.001). c Accuracies in the low-intensity condition separated by temporal delay. Behavioral performance was uniquely increased at the first “missing” acoustic pulse edge—coincident with the phase reset we observe in neural low-frequency response. d, e The same electrode group shown in Fig. 1b was used for the following analyses. Violin plots demonstrating engagement of low-frequency phase and high-gamma power during each interval. The sustained response in low-frequency phase was measured as average ITC; in high-gamma power, it was measured as a signed r2 from the Spearman’s correlation with a 3-Hz sine wave. Both low-frequency phase and high-gamma power were significantly engaged during the onset and sustained intervals (p < 10−3, p < 10−3; p = 0.0012, p = 0.0017), but only low-frequency phase remained significantly engaged during the first prediction interval (p < 10−3). f All electrodes on the supratemporal plane (n = 349) were evaluated for a significant sustained response during the rhythmic stimulus followed by low-frequency phase reset in the first prediction interval. Those with a significant predictive effect are shown in blue (n = 36), predominantly found in HG/TTS.

