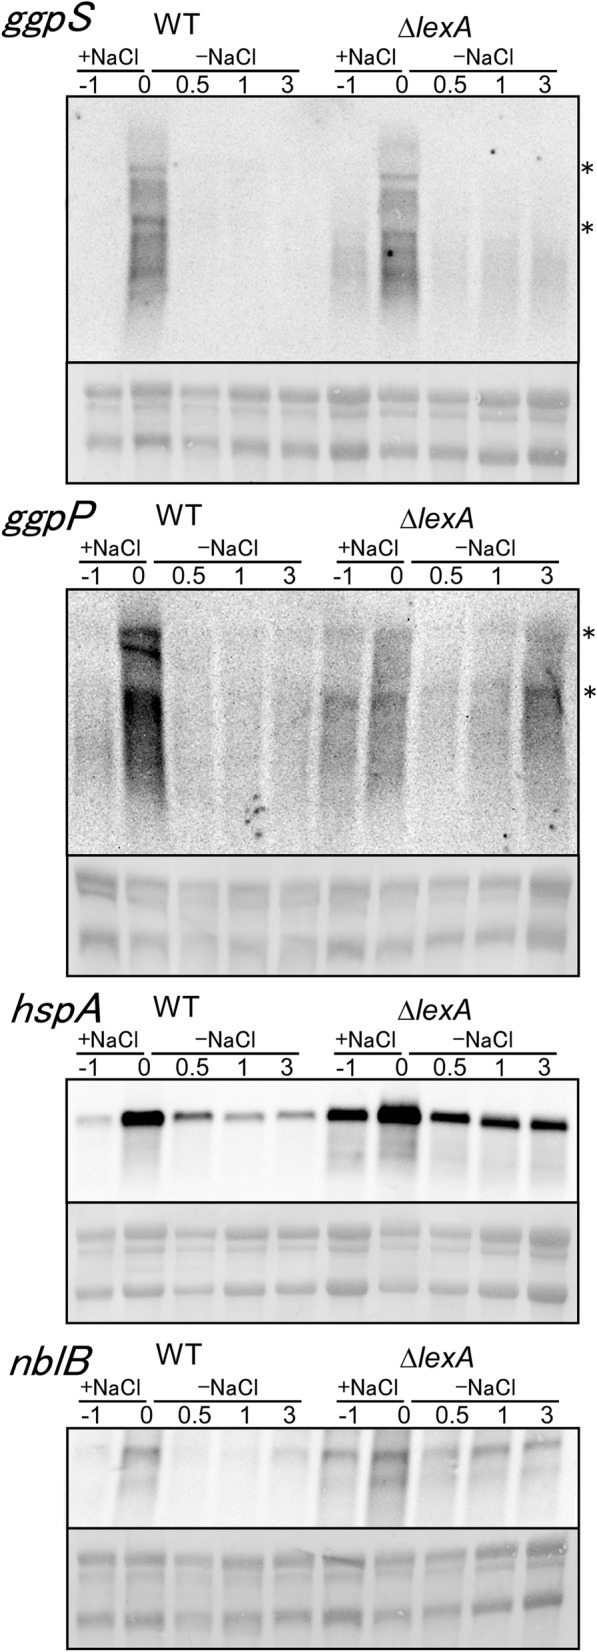
Figure 5.

Changes in transcript levels upon the downshift in salt concentration in WT and ΔlexA strains. Total RNA was isolated from cells before (− 1 h) and after 1 h of incubation with 500 mM NaCl (0 h) and at time points indicated after transferred to the normal BG-11 medium (0.5, 1 and 3 h). 5 μg of total RNA was applied to each lane for RNA gel blot analysis and transcripts were detected by using single-stranded riboprobes of ggpS, ggpP, hspA and nblB. rRNA was visualized with methylene blue staining to show the equal RNA loading. The location of 23S and 16S rRNA was shown by asterisks.
