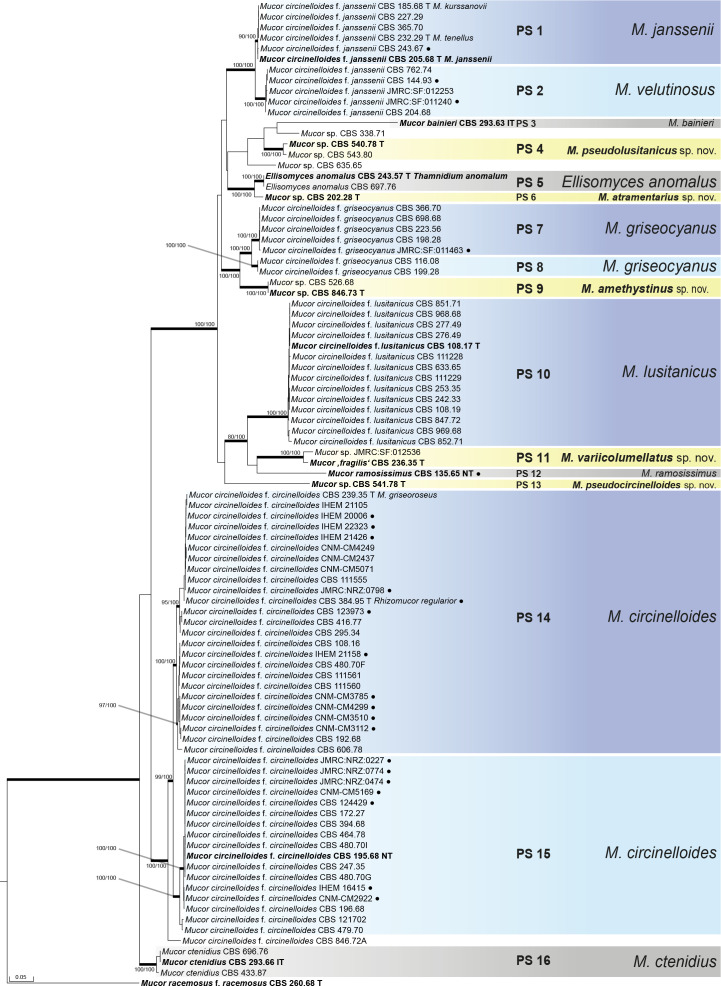
Fig. 2.
Phylogenetic tree based on the concatenated alignment of five molecular markers (cfs, mcm7, ITS, rpb1, tsr1) calculated using RAxML. Branches with bootstrap values ≥ 75 in the RAxML and/or the Maximum Parsimony analyses are printed in bold and the bootstrap values are given, in this order. T = ex-type strain, IT = ex-isotype strain and NT = ex-neotype strain. Ex-type strains of currently accepted taxa are printed in bold. Clinical isolates are marked by black circles.

