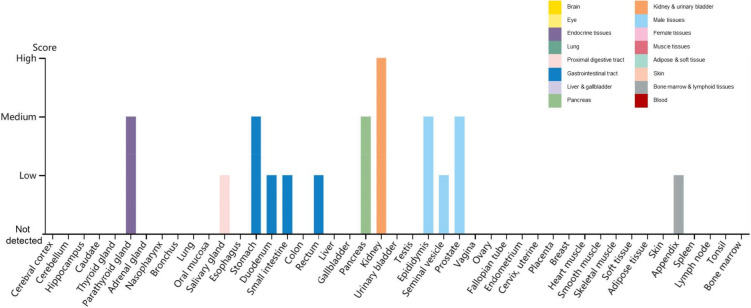
Fig. 2.
Distribution of TMPRSS2 in human tissues and organs. The expression levels of TMPRSS2 protein in the annotated tissues and organs are presented based on the immunohistochemistry data provided by the Human Protein Atlas (HPA). Color-coding is based on tissue groups, each consisting of tissues with functional features in common. Protein expression score is based on immunohistochemical data manually scored with regard to staining intensity (negative, weak, moderate or strong) and fraction of stained cells (< 25%, 25–75% or > 75%). Each combination of intensity and fractions is automatically converted into a protein expression level score as follows: negative—not detected; weak combined with < 25%—not detected; weak combined with either 25–75% or 75%—low; moderate combined with < 25%—low; moderate combined with either 25–75% or 75%—medium; strong combined with < 25%—medium; strong combined with either 25–75% or 75%—high.

