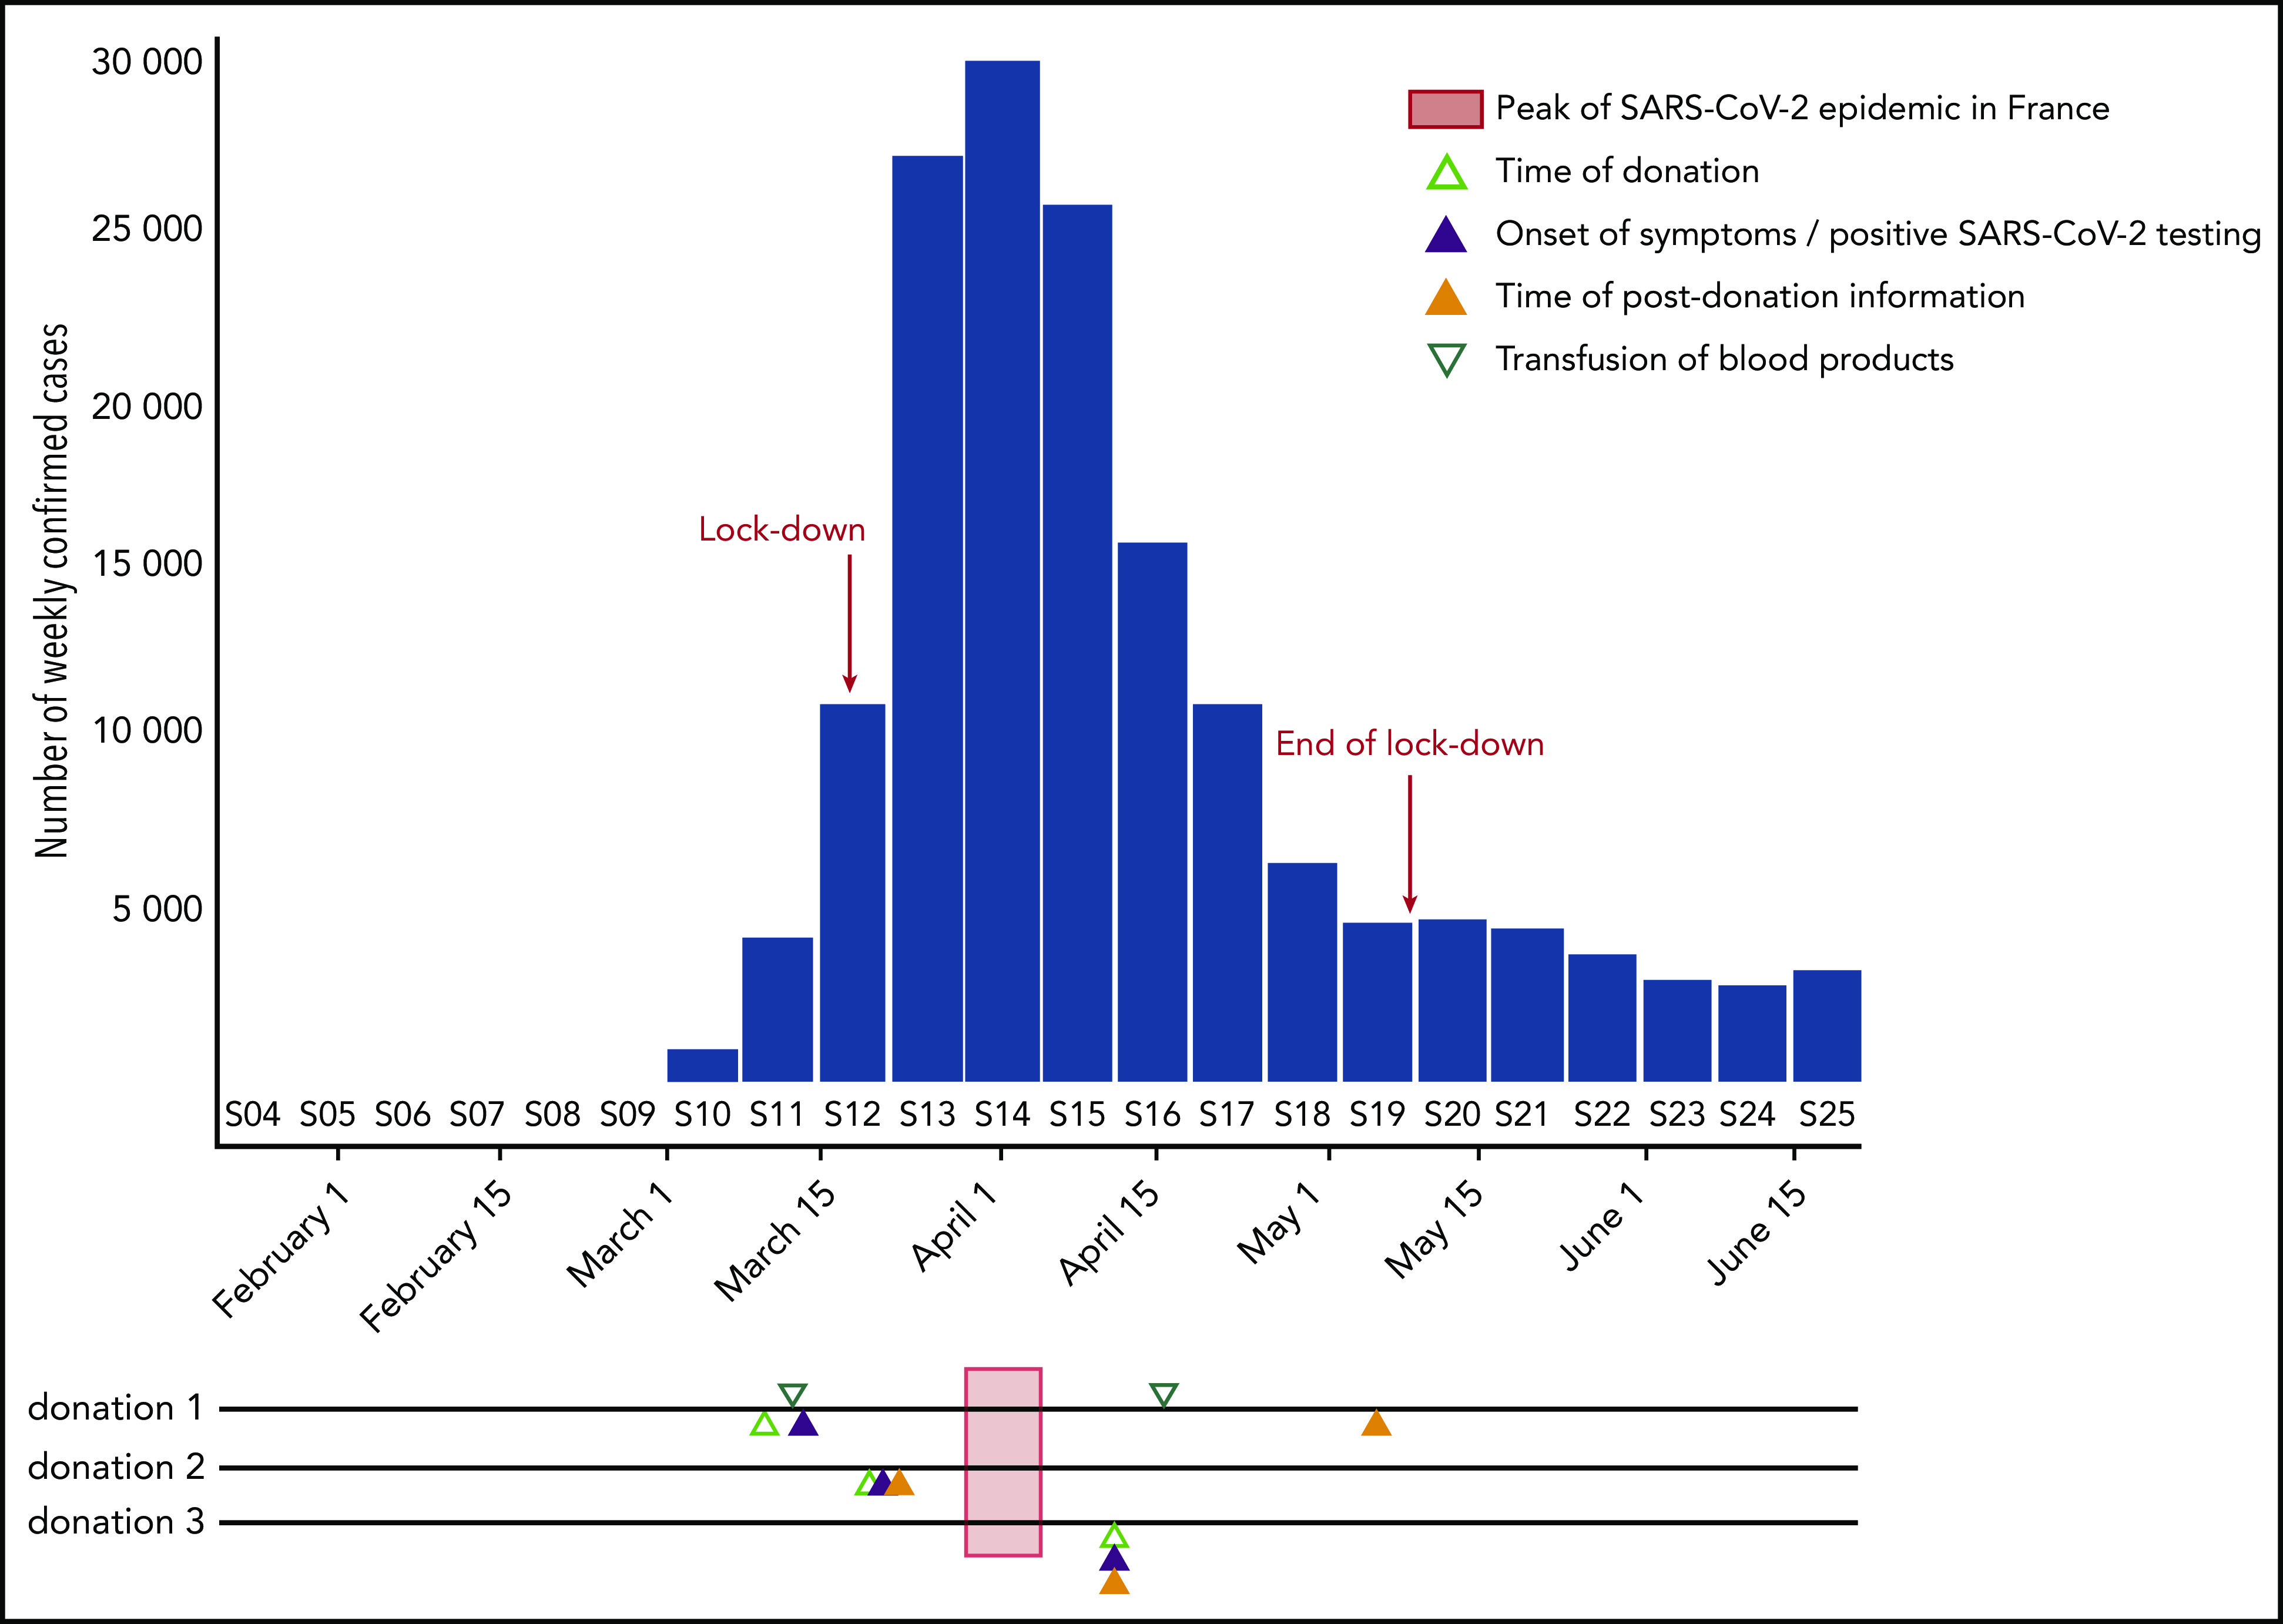
Figure 1.

Timeline SARS-CoV-2RNA–positive donations with regard to the epidemic curve in France. The weekly number of incident confirmed COVID-19 cases, as reported to the French National Public Health Agency (SpF), is shown by the blue bars. On the timelines corresponding to the 3 SARS-CoV-2–positive donations are shown the time of donation (open light green triangle), the onsets of symptoms or the day of positive testing (full blue triangle), the time of transfusion of blood products (open green triangle), and the time of postdonation information (full orange triangle). The epidemic peak (week 14) is indicated by a light red bar crossing the timelines.
