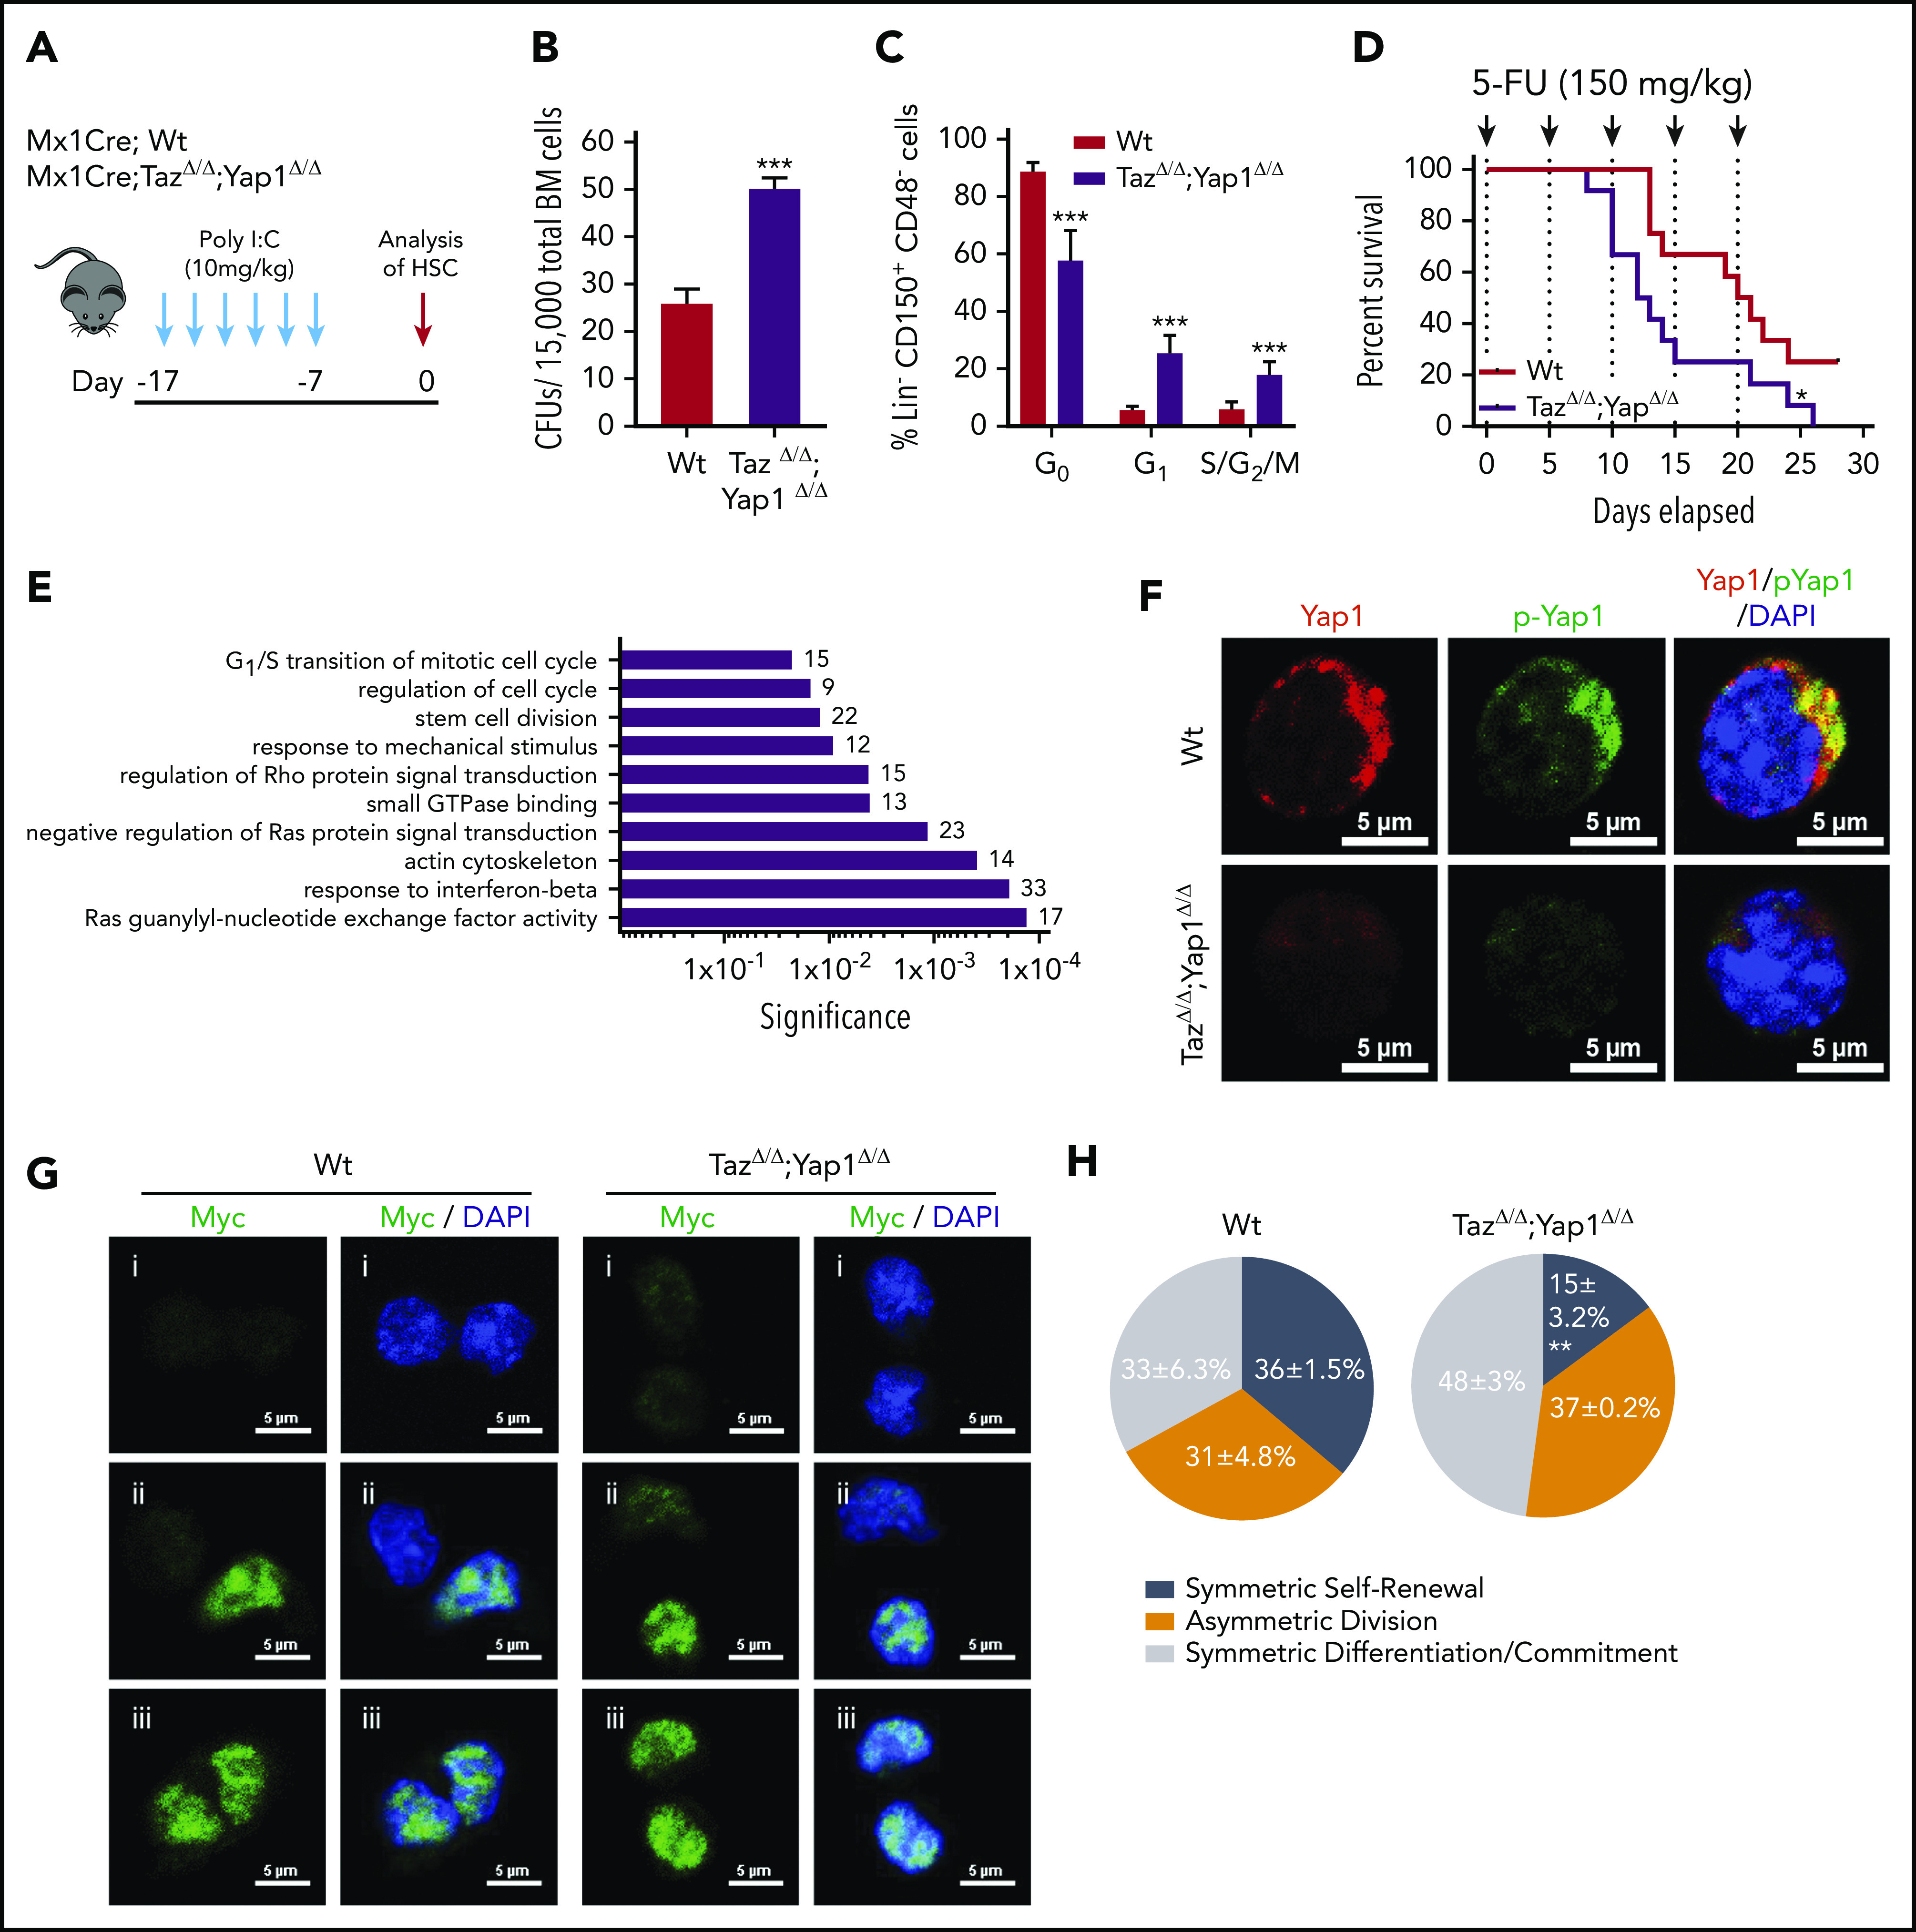
Figure 1.

Yap1/Taz are necessary for HSC function. (A) Schematic representing the inducible deletion of Yap1/Taz in the hematopoietic system followed by 1 week of recovery before subjecting mice to experimental testing. (B) Number of colony-forming units (CFUs) from Mx1Cre;Wt and Mx1Cre;TazΔ/Δ;Yap1Δ/Δ total BM cells. (C) Cell-cycle analysis of Lin− CD48− CD150+ HSC by fluorescence-activated cell sorting (FACS). (D) Kaplan-Meier survival analysis after serial myeloablation with 5-fluorouracil (150 mg/kg) 5 days apart. (E) Gene ontology (GO) pathway analysis of differentially regulated genes (P < .05) between Mx1Cre;Wt and Mx1Cre;TazΔ/Δ;Yap1Δ/Δ HSC (cutoff, 1.5-fold). Numbers represent the percentage of genes within each GO pathway that are differentially regulated. (F) Immunofluorescence depicting Yap1 protein localization in Wt HSC (immunophenotypically defined as LSK CD150+ CD48−) (red pseudo-color) and Yap1 phosphorylation status at Serine 112 (green pseudo-color). Cells are counterstained with 4′,6-diamidino-2-phenylindole (DAPI) and merged images are shown in the right micrographs. Scale bar is 5 µm. (G) Immunofluorescence depicting fate determinant allocation of Myc and the corresponding HSC division mode in Wt and Yap1/TazΔ/Δ paired daughter HSC (nocodazole, 10 nM for 24 hours). Low Myc expression in paired daughter cells represents (i) symmetric self-renewal, (ii) high and low Myc expression between the 2 daughters represents an asymmetric division, whereas (iii) high Myc expression in both cells is indicative of symmetric commitment. (H) Quantification of fate determinant allocation and division mode among Wt and Yap1/TazΔ/Δ paired daughter HSC. *P < .05; **P < .01; ***P < .001.
