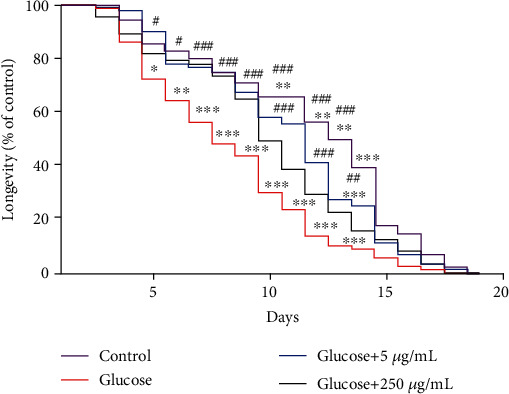
Figure 3.

Effect of different concentration of ECE on glucose-induced toxicity in worms' life span. Values are expressed as mean ± S.E.M. of four experiments. Data were analyzed by using a repeated measures two-way ANOVA followed by the Tukey posttest. ∗ indicates p < 0.05; ∗∗ indicates p < 0.01; ∗∗∗ indicates p < 0.001 when compared to the control group. # indicates p < 0.05; ## indicates p < 0.01; ### indicates p < 0.001 when compared to the glucose group.
