
Figure 10.
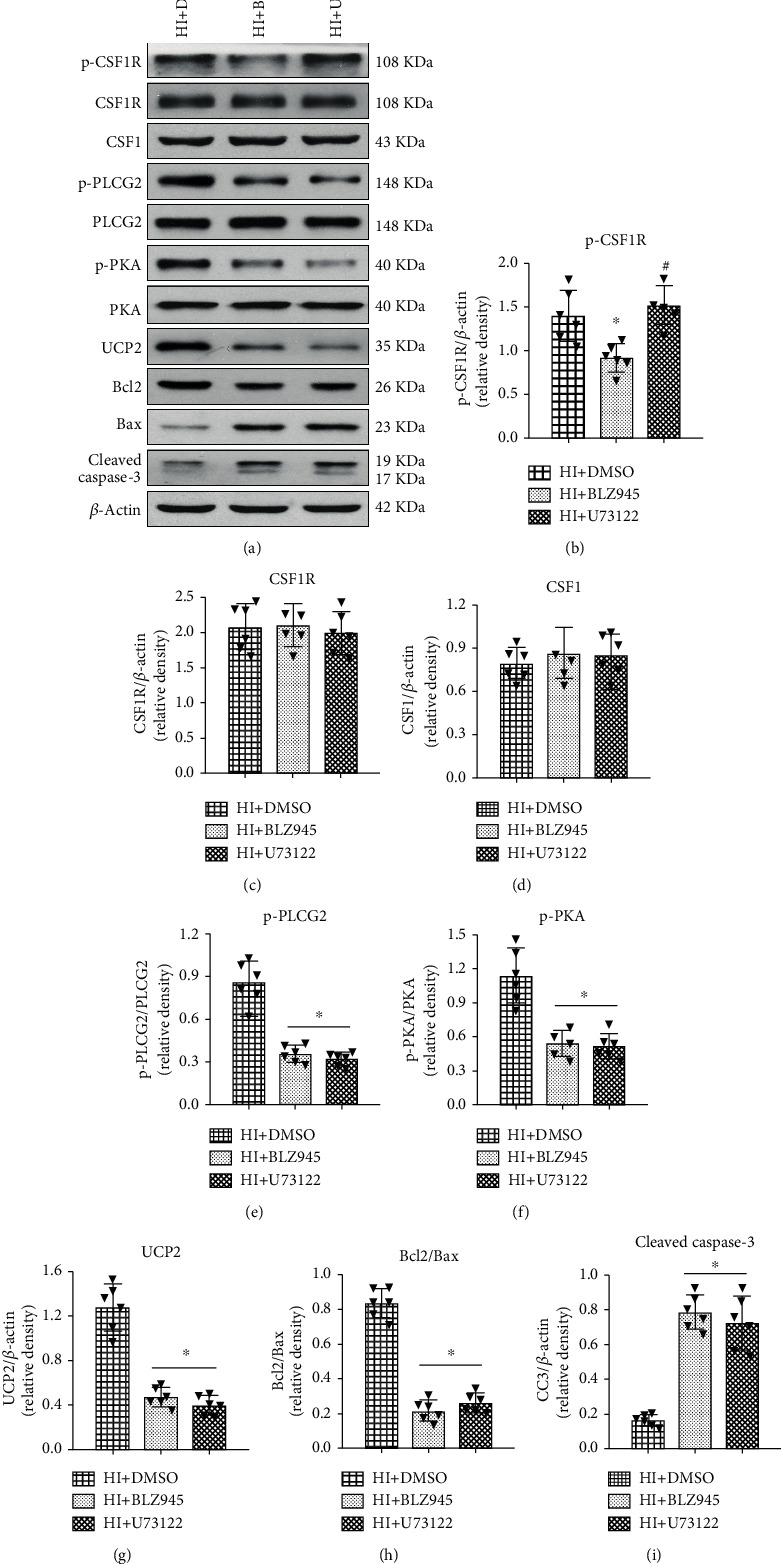
Effects of CSF1R and PLCG2 inhibitor on pathway-related protein expression levels at 48 h after HI. (a) Representative western blot bands of p-CSF1R, CSF1R, CSF1, p-PLCG2, p-PKA, UCP2, Bcl2, Bax, and cleaved caspase-3. (b–i) Quantitative analysis of the relative protein levels at 48 h after HI. Data are represented as means ± SD. ∗P < 0.05 vs. HI+DMSO; #P < 0.05 vs. HI+BLZ945. n = 6 for each group.