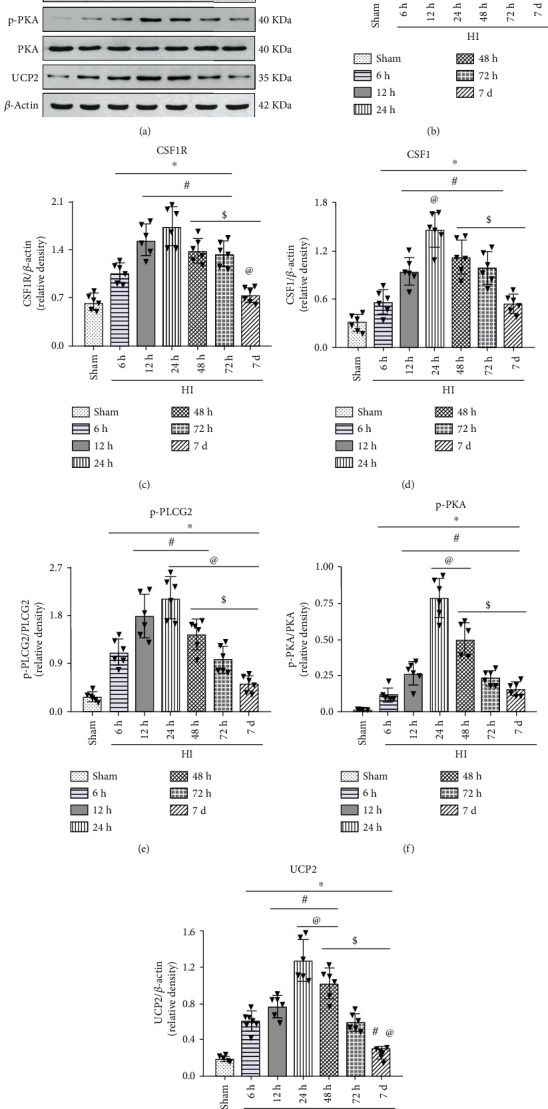
Figure 2.

Temporal expression of endogenous p-CSF1R, CSF1R, CSF1, p-PLCG2, p-PKA, and UCP2 in the brain after HI. (a) Representative western blot bands. (b–g) Quantitative analysis of the relative protein levels of p-CSF1R, CSF1R, CSF1, p-PLCG2, p-PKA, and UCP2 after HI insult. ∗P < 0.05 vs sham; #P < 0.05 vs 6 h HI; @P < 0.05 vs 12 h HI; $P < 0.05 vs 24 h HI. n = 6 per group.
