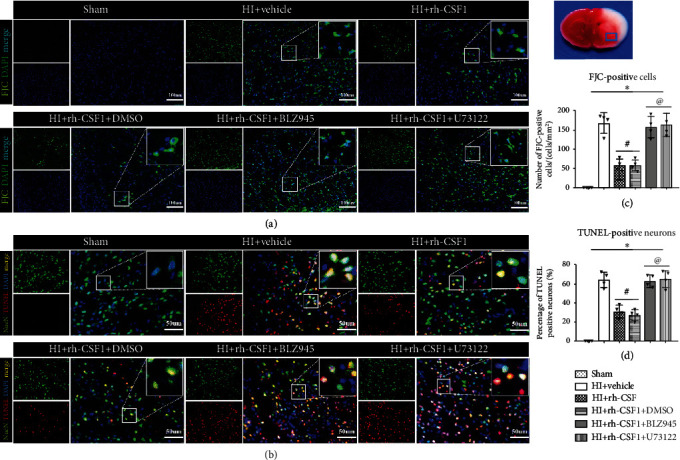
Figure 9.

Effects of rh-CSF1 on neuronal degeneration and apoptosis after HI at 48 h after HI. (a) Representative microphotographs of FJC staining in the ipsilateral cortex of the rat brain. (b) Representative microphotographs of TUNEL staining in the ipsilateral cortex of the rat brain. (c) Quantitative analysis of FJC-positive cells in the ipsilateral cortex. (d) Quantitative analysis of TUNEL-positive neurons in the ipsilateral cortex. ∗P < 0.05 vs. sham; #P < 0.05 vs. HI+vehicle; @P < 0.05 vs. HI+rh-CSF1+DMSO; scale bar = 100 μm (FJC staining); scale bar = 50 μm (TUNEL staining), n = 4 per group. The upper right panel of brain slice indicates the location for staining analysis (small blue box).
