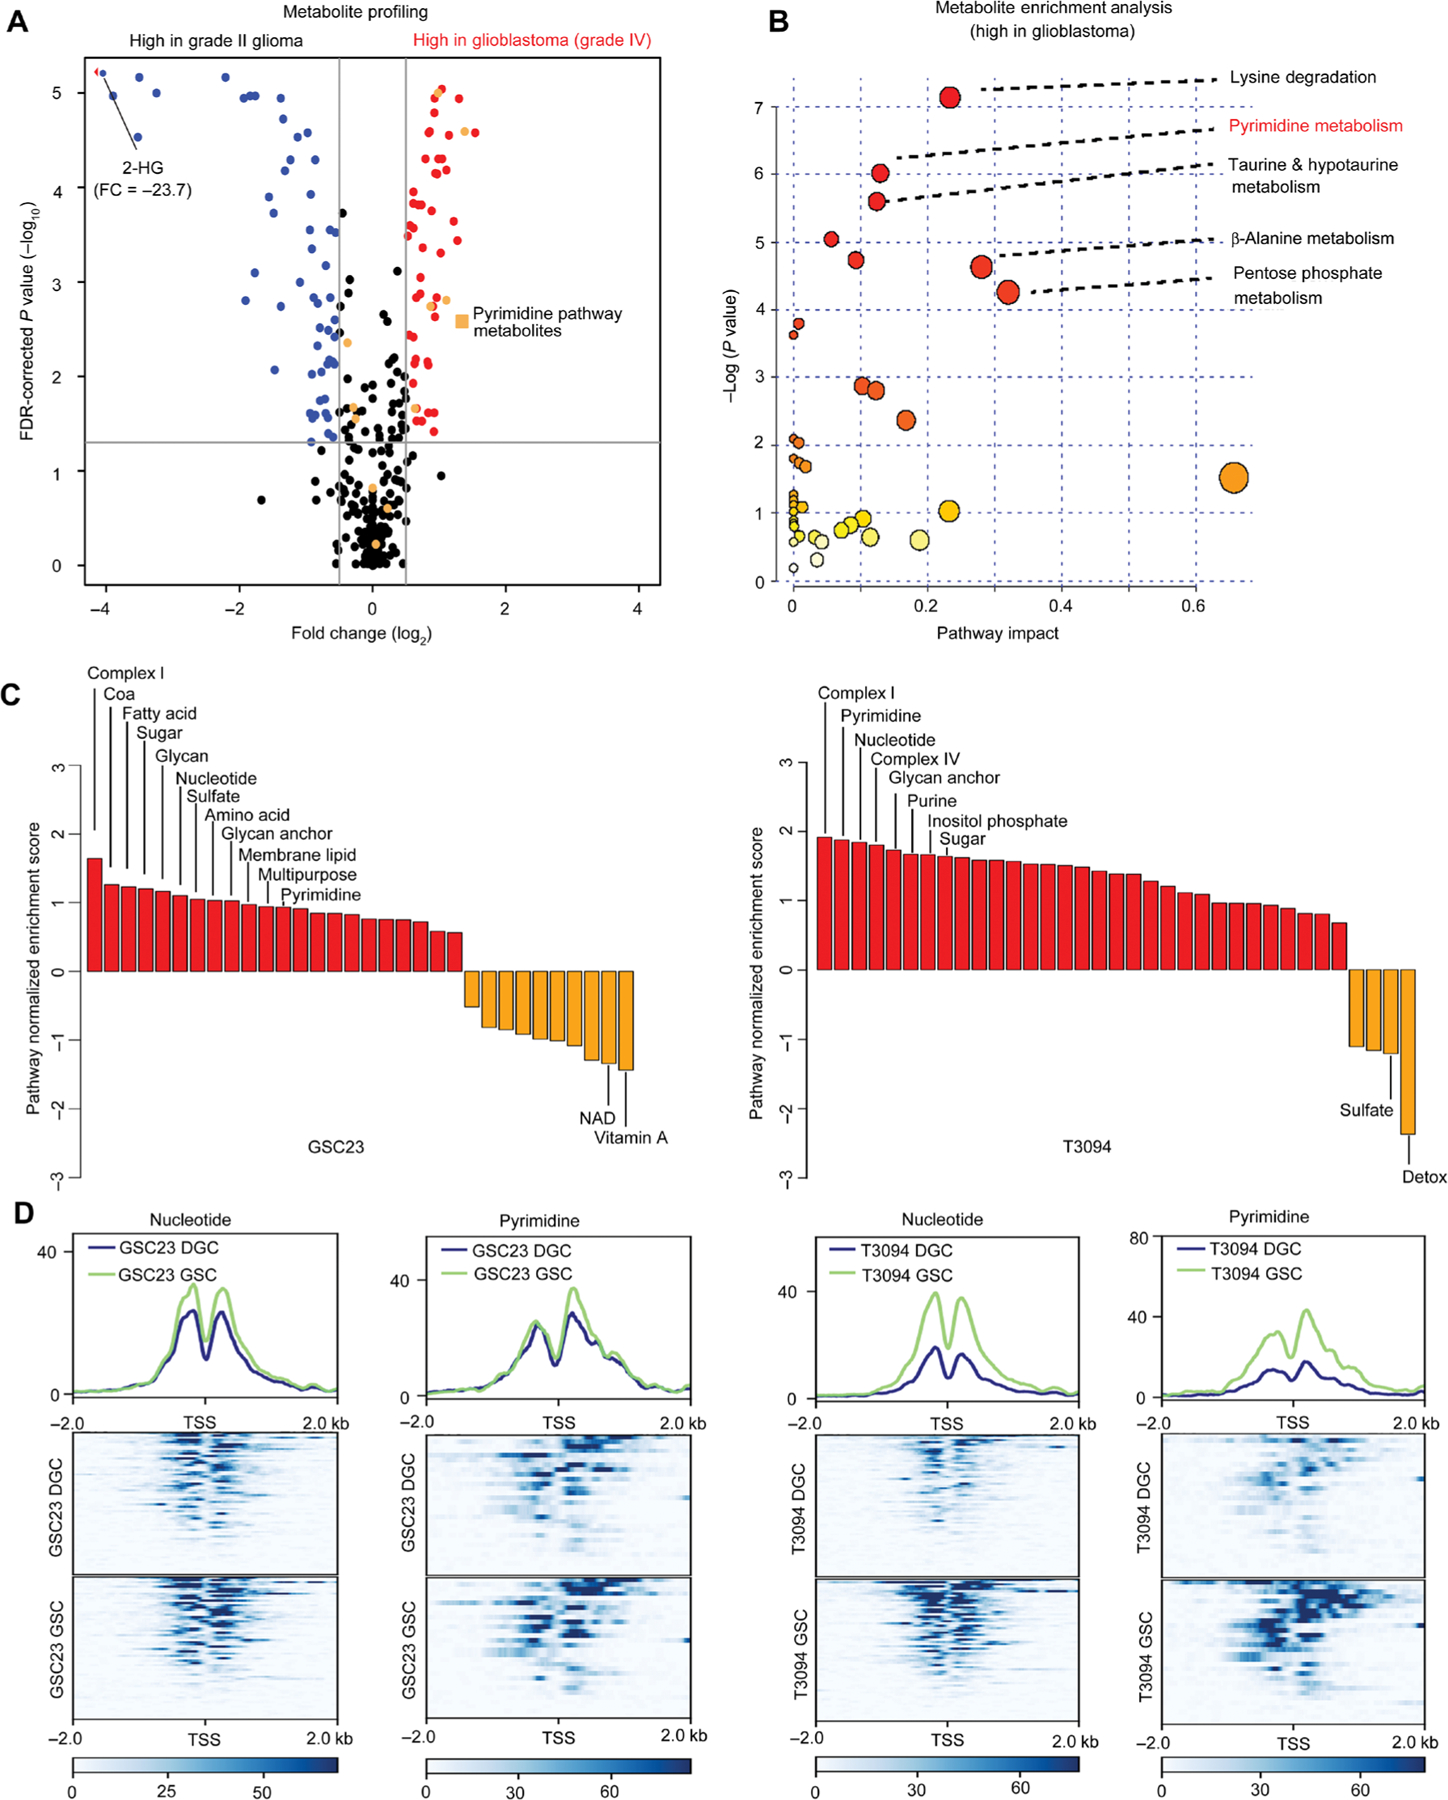
Fig. 1. Profiling reveals specific up-regulation of de novo pyrimidine synthesis pathway in GSCs.

(A) Comparative metabolomic analysis of grade II glioma (n = 18) versus glioblastoma (n = 36). Volcano plot showing differential metabolite abundances from primary tumor samples between grade II glioma and glioblastoma (25). Red dots indicate metabolites that were increased [false discovery rate (FDR) P < 0.05] in glioblastoma compared to grade II glioma, whereas blue dots indicate those that were decreased (FDR P < 0.05). Orange dots indicate metabolites in the pyrimidine synthesis pathway. 2-HG, 2-hydroxyglutarate. (B) Metabolite pathway enrichment analysis of metabolites increased [FDR P < 0.05; fold change (FC) > 1] in glioblastoma compared to grade II glioma (25). Pathway impact refers to the importance of altered metabolites in the respective metabolic pathway, as calculated by Metabo-Analyst. (C) Enrichment analysis of all metabolic pathways up-regulated in glioblastoma stem cells (GSCs; red) versus differentiated glioblastoma cells (DGCs; orange) derived from differential H3K27ac in the GSC23 and T3094 glioblastoma models. NAD, nicotinamide adenine dinucleotide. (D) Patient-derived GSCs (GSC23 and T3094) were cultured under serum-free conditions to maintain their GSC state or induced into DGCs and then subjected to histone 3 lysine 27 acetyl chromatin immunoprecipitation followed by deep sequencing (H3K27ac ChIP-seq). Comparative coverage plots between matched GSCs and DGCs illustrate the specific promoters of matched GSC23 and T3094 GSCs and DGCs for focused metabolic pathways. Heat maps are shown to depict H3K27ac signal, normalized to read depth, for ±5 kb surrounding enhancer peaks. Color scale indicates reads per kilobase per million mapped reads (RPKM). The y axis is also normalized H3K27ac read depth (RPKM). Transcriptional start sites (TSS) for selected metabolic genes were mapped for nucleotide and pyrimidine metabolism. Pathway enrichment was assessed using single-sample gene set enrichment analysis (ssGSEA) comparing pathway enrichment scores between GSCs and DGCs [GSC23: P < 0.0001 (nucleotide) and P = 0.0178 (pyrimidine); T3094: P < 0.0001 (nucleotide) and P < 0.0001 (pyrimidine); sign test was used for statistical analysis].
