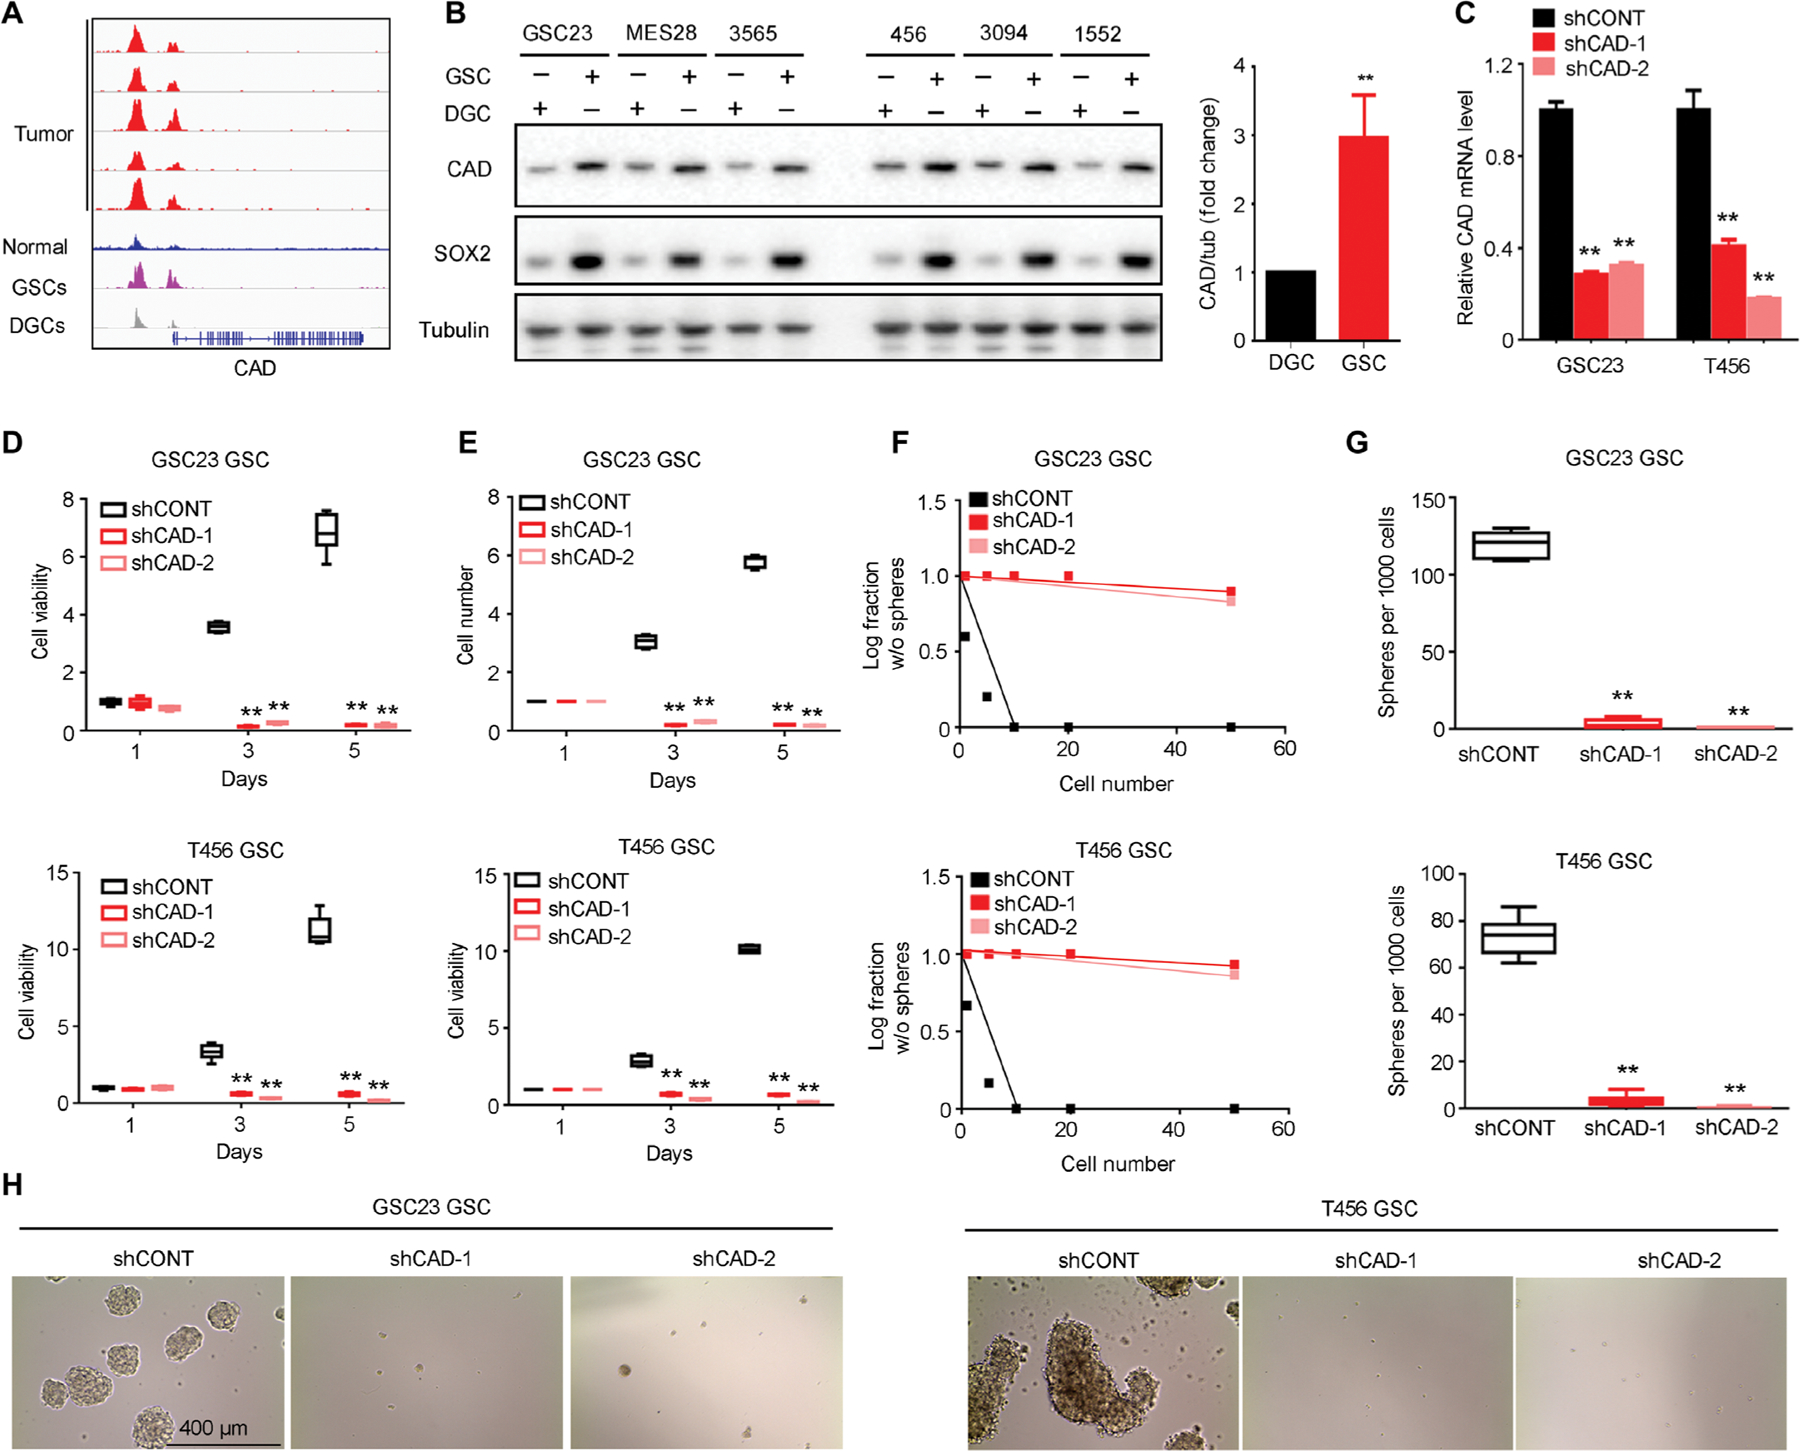
Fig. 2. CAD regulates GSC growth and self-renewal.

(A) H3K27ac ChIP-seq enrichment plot centered at the gene locus for CAD. Active chromatin was profiled by H3K27ac ChIP-seq for five primary glioblastoma tumors, five normal brain tissues, and three matched pairs of GSCs and DGCs from patient-derived glioblastoma specimens. Raw data from enhancer profiling of primary glioma tissues were downloaded from GSE101148. Matched pairs of GSCs and DGCs and normal tissues H3K27ac ChIP-seq data were downloaded from NCBI Gene Expression Omnibus GSE54047 and GSE17312. (B) Protein concentrations of CAD with normalized quantifications in matched pairs of GSCs and DGCs across human glioblastoma specimens GSC23, MES28, T3565, T456, T3094, and T1552 (n = 6 biological replicates; **P < 0.01, one-way ANOVA). (C) Quantitative RT-PCR assessment of CAD mRNA in GSC23 and T456 GSCs expressing a nontargeting control shRNA (shCONT), shCAD-1, or shCAD-2 (n = 6 independent experiments per group; **P < 0.01, one-way ANOVA). (D) Cell growth of GSC23 and T456 GSCs expressing shCONT, shCAD-1, or shCAD-2 was measured by CellTiter-Glo assay (n = 5 independent experiments per group; **P < 0.01, one-way ANOVA). (E) Growth of GSC23 and T456 GSCs expressing shCONT, shCAD-1, or shCAD-2 was measured by direct cell number count (n = 5 independent experiments per group; **P < 0.01, one-way ANOVA). (F) Sphere formation using an extreme limiting dilution assay (ELDA) was performed with GSC23 and T456 GSCs expressing shCONT, shCAD-1, or shCAD-2 (GSC23, P < 0.01; T456, P < 0.01, ELDA analysis). (G) The number of spheres formed using GSC23 and T456 GSCs expressing shCONT, shCAD-1, or shCAD-2 was determined with ELDA per 1000 cells seeded (n = 6 independent experiments per group; **P < 0.01, one-way ANOVA). (H) Representative images of neurospheres derived from GSC23 and T456 GSCs expressing shCONT, shCAD-1, or shCAD-2. Scale bar, 400 μm. Each image is representative of at least five similar experiments.
