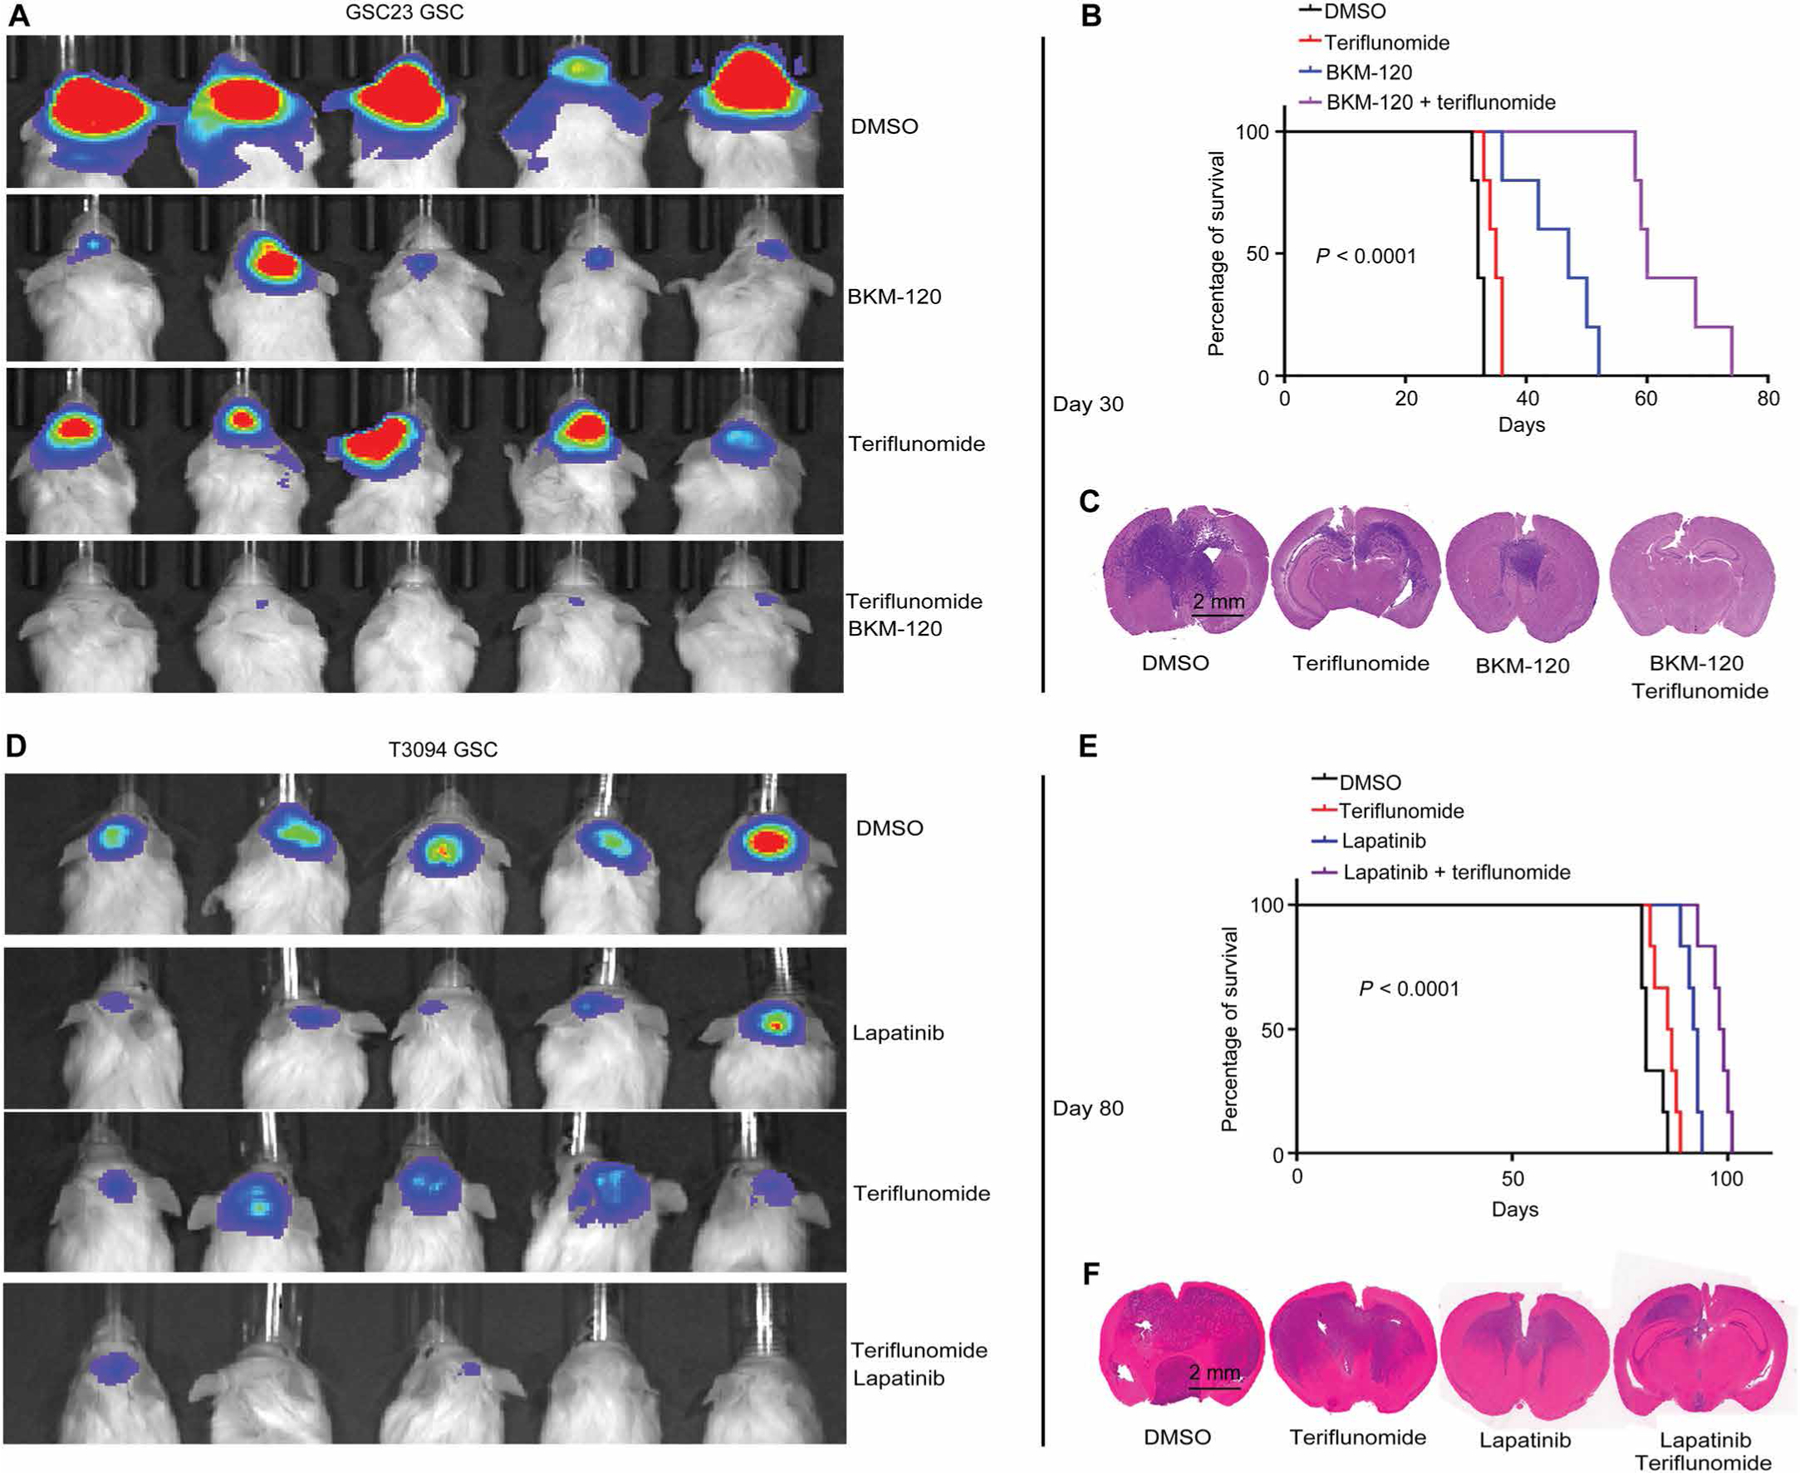
Fig. 6. Combined targeting of pyrimidine synthesis inhibits GSC tumorigenesis in vivo.

(A) GSCs (GSC23) were transduced with firefly luciferase before implantation into NOD.Cg-Prkdcscid Il2rgtm1Wjl/SzJ (NSG) immunocompromised mice. In vivo bioluminescence imaging was performed on NSG mice bearing intracranial xenografts derived from PTEN-deleted GSC23 treated with vehicle control (DMSO), teriflunomide monotherapy (50 mg/kg per day), BKM120 monotherapy (50 mg/kg per day), or the combination of teriflunomide (50 mg/kg per day) and BKM120 (50 mg/kg per day) (n = 5 independent experiments per group). (B) Kaplan-Meier survival curves of immunocompromised mice bearing intracranial tumors derived from PTEN-deleted GSC23 from the four treatment groups in (A) (n = 5 for each group; P < 0.0001, log-rank test). (C) Representative images of hematoxylin and eosin-stained sections of mouse brains from six independent experiments per group collected on day 35 after transplantation of PTEN-deleted GSC23 from the four treatment groups in (A). Scale bar, 2 mm. (D) In vivo bioluminescence imaging was performed on NSG mice bearing intracranial xenografts derived from EGFR-amplified T3094 GSCs treated with vehicle (DMSO), teriflunomide monotherapy (50 mg/kg per day), lapatinib monotherapy (50 mg/kg per day), or the combination of teriflunomide (50 mg/kg per day) and lapatinib (50 mg/kg per day) (n = 6 independent experiments per group). (E) Kaplan-Meier survival curves of immunocompromised mice bearing intracranial tumors derived from EGFR-amplified T3094 from the four treatment groups in (D) (n = 6 for each group; P < 0.0001, log-rank test). (F) Representative images of hematoxylin and eosin-stained sections of mouse brains from six independent experiments per group collected on day 35 after transplantation of EGFR-amplified T3094 GSCs from the four treatment groups in (D). Scale bar, 2 mm.
